OPEN-SOURCE SCRIPT
Artharjan High Volume Zones v2

Artharjan High Volume Zones (AHVZ)
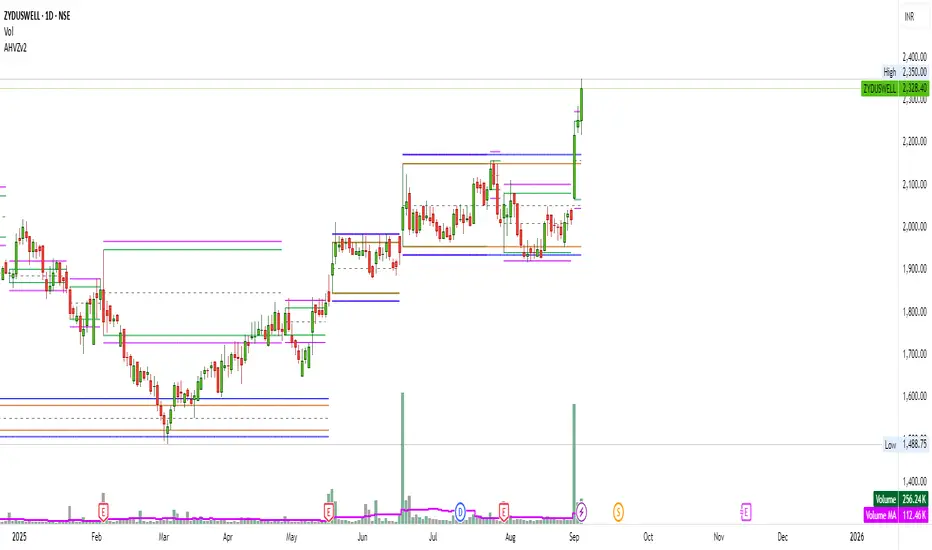
The Artharjan High Volume Zones (AHVZ) indicator is designed to identify, highlight, and track price zones formed during exceptionally high-volume bars. These levels often act as critical support and resistance zones, revealing where institutions or large players have shown significant interest.
By combining both short-term (ST) and long-term (LT) high-volume zones, the tool enables traders to align intraday activity with broader market structures.
Core Purpose
Markets often leave behind footprints in the form of high-volume bars. The AHVZ indicator captures these footprints and projects their influence forward, allowing traders to spot zones of liquidity, accumulation, or distribution where future price reactions are likely.
Key Features
🔹 Short-Term High Volume Zones (ST-ZoI)
Identifies the highest-volume bar within a short-term lookback period (default: 22 bars).
Draws and maintains:
Upper & Lower Bounds of the high-volume candle.
Midpoint Line (M-P) as the zone’s equilibrium.
Buffer Zones above and below for intraday flexibility (percentage-based).
Highlights these zones visually for quick intraday decision-making.
🔹 Long-Term High Volume Zones (LT-ZoI)
Scans for the highest-volume bar in a long-term lookback period (default: 252 bars).
Similar plotting structure as ST-ZoI: Upper, Lower, Midpoint, and Buffers.
Useful for identifying institutional footprints and multi-week/month accumulation zones.
🔹 Dynamic Buffering
Daily/Weekly/Monthly charts: Adds a fixed percentage buffer above and below high-volume zones.
Intraday charts: Uses price-range based buffers, scaling zones more adaptively to volatility.
🔹 Visual Customization
Independent color settings for ST and LT zones, mid-range lines, and buffers.
Adjustable plot thickness for clarity across different chart styles.
How It Helps
Intraday Traders
Use ST zones to pinpoint short-term supply/demand clusters.
Trade rejections or breakouts near these high-volume footprints.
Swing/Positional Traders
Align entries with LT zones to stay on the side of institutional flows.
Spot areas where price may stall, reverse, or consolidate.
General Market Structure Analysis
Understand where volume-backed conviction exists in the chart.
Avoid trading into hidden walls of liquidity by recognizing prior high-volume zones.
Closing Note
The Artharjan High Volume Zones indicator acts as a volume map of the market, giving traders a deeper sense of where meaningful battles between buyers and sellers took place. By combining short-term noise filtering with long-term structural awareness, it empowers traders to make more informed, disciplined decisions.
With Thanks,
Rrahul Desai Artharjan
오픈 소스 스크립트
트레이딩뷰의 진정한 정신에 따라, 이 스크립트의 작성자는 이를 오픈소스로 공개하여 트레이더들이 기능을 검토하고 검증할 수 있도록 했습니다. 작성자에게 찬사를 보냅니다! 이 코드는 무료로 사용할 수 있지만, 코드를 재게시하는 경우 하우스 룰이 적용된다는 점을 기억하세요.
I am a professional trader and have passion for teaching and programming. In case anyone is interested to know more then feel to drop me a line at rahul30m@gmail.com / +91-9136096161
면책사항
해당 정보와 게시물은 금융, 투자, 트레이딩 또는 기타 유형의 조언이나 권장 사항으로 간주되지 않으며, 트레이딩뷰에서 제공하거나 보증하는 것이 아닙니다. 자세한 내용은 이용 약관을 참조하세요.