INVITE-ONLY SCRIPT
업데이트됨 Blockunity Rainbow Score (BRS)
The goal of this indicator, based on several technical analysis metrics, is to help investors quickly and efficiently visualize whether an asset appears to be in a buy or sell zone. It works in a simple way, with a color code and a score, as well as arrows giving signals.
Usage Advice
This indicator can be used on its own, ideally in daily or weekly timeframes, but it also works with other periods. With the « BRS Timeframe » setting, it is possible, for example, to see the BRS values and signals calculated on a daily basis while being on a weekly timeframe chart. Use your graph in logarithmic scale.
The zones and signals indicated by the BRS can be effectively coupled with a DCA strategy.
If the asset you wish to observe has been listed very recently or has limited history, enable the « Very young asset » option in the BRS settings.
If you want to observe assets that are not cryptoassets, make sure to set the BRS settings « Market Mode » to the option « Traditional ».
The Different Elements And Signals
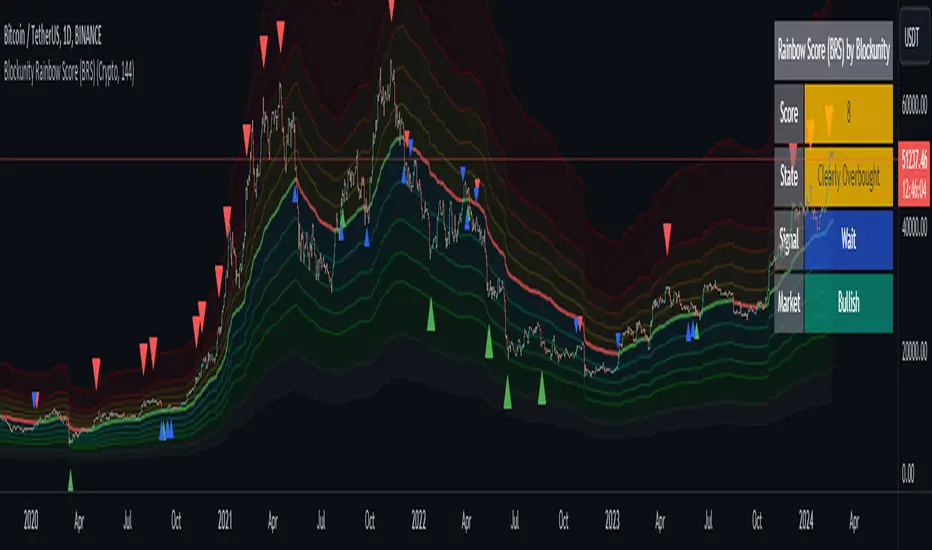
The base of this indicator is first of all an optimized moving average, taking into account the volatility of the asset. This varies from green to red depending on whether the asset price is above or below this average.
Around this baseline are formed several bands. The lower bands (blue to green shades) form oversold areas. In these regions, it is recommended to buy rather than sell. Conversely, in the upper areas (yellow to red tones), represent overbought levels. It is then recommended to make sales.
To see at a glance in which zone we are currently located, we have added a panel with the score and the current signal.
In the panel there is also a strategy indication. This indication is coupled with the arrows (red, green and blue) that can be seen scattered across the chart.
These arrows indicate when the asset is considered to be at an inflection point, a change in trend. Behind this is a mechanism that takes into account volatility , momentum and trend. The green arrows indicate buying opportunities and the red arrows indicate selling times. The blue arrows (optional display to be activated in the parameters) give indications with less confidence, they are weaker but more aggressive signals. The signal is to be taken up or down depending on the direction of the arrow.
Finally, we give an indication of the market phase in which the asset is situated. Above the main line we consider to be in a bullish market and below in a bearish market.
Usage Advice
This indicator can be used on its own, ideally in daily or weekly timeframes, but it also works with other periods. With the « BRS Timeframe » setting, it is possible, for example, to see the BRS values and signals calculated on a daily basis while being on a weekly timeframe chart. Use your graph in logarithmic scale.
The zones and signals indicated by the BRS can be effectively coupled with a DCA strategy.
If the asset you wish to observe has been listed very recently or has limited history, enable the « Very young asset » option in the BRS settings.
If you want to observe assets that are not cryptoassets, make sure to set the BRS settings « Market Mode » to the option « Traditional ».
The Different Elements And Signals
The base of this indicator is first of all an optimized moving average, taking into account the volatility of the asset. This varies from green to red depending on whether the asset price is above or below this average.
Around this baseline are formed several bands. The lower bands (blue to green shades) form oversold areas. In these regions, it is recommended to buy rather than sell. Conversely, in the upper areas (yellow to red tones), represent overbought levels. It is then recommended to make sales.
To see at a glance in which zone we are currently located, we have added a panel with the score and the current signal.
In the panel there is also a strategy indication. This indication is coupled with the arrows (red, green and blue) that can be seen scattered across the chart.
These arrows indicate when the asset is considered to be at an inflection point, a change in trend. Behind this is a mechanism that takes into account volatility , momentum and trend. The green arrows indicate buying opportunities and the red arrows indicate selling times. The blue arrows (optional display to be activated in the parameters) give indications with less confidence, they are weaker but more aggressive signals. The signal is to be taken up or down depending on the direction of the arrow.
Finally, we give an indication of the market phase in which the asset is situated. Above the main line we consider to be in a bullish market and below in a bearish market.
릴리즈 노트
- Added Alerts:1. Click on the “Alert” tab on top of the window.
2. In the pop-up window, select the Strategy in “Condition” and select “alert() function calls only”.
3. Set an expiration date and an alert name (personalized).
4. Accept the Pop-Up alert concerning the log/linear calculation.
5. In the “Notifications” tab, select in which way you want to be alerted.
6. You have to do these steps for every asset you wish to get the alerts from.
7. To manage existing alerts, go on the right side and click the clock icon.
릴리즈 노트
BRS Update:- Possibility to choose the desired timeframe in which the curves and indications will be calculated.
- Possibility to choose the panel's placement.
- Improved french translation.
릴리즈 노트
Default BRS Timeframe from "Chart" to "Daily".릴리즈 노트
Major BRS update, please read the following points carefully.:- Revision of the whole mechanism in order to further improve its performance and relevance. Volatility is now taken into account in the central moving average and no longer in the calculation of the bands.
- Added many options and settings. They are all optional and explained directly in the settings of the indicators via the tooltips.
- Reworked the design and added input so you can make adjustments more easily.
- Deactivation of the weak signal display by default.
- Added a mode in the settings to adapt the BRS to the traditional market.
- For the moment we have removed the 'Timeframe Selector' functionality, the BRS is used again in daily time units for now.
- Changed the signal triggering method and added filtering options.
- The central moving average now also indicates the market trend. It is green to indicate a bull market and red to indicate a bear market.
- Added a 'Very young asset' checkbox in the parameters allowing to use the BRS even on assets with very limited history.
릴리즈 노트
- Added an option to display trend change signals.
- Added an option to display the moving average triggering the retest signals (hidden by default).
- Modification to allow color changes in the design parameters of the indicator.
릴리즈 노트
- Minor optimization of the central moving average.
- Add a range detection system to filter retest signals and improve their quality.
- Default activation of potential retest signals (now that they are better filtered).
릴리즈 노트
- New data table design. Moreover, it is now fully configurable.
- A few other design adjustments.
릴리즈 노트
Addition of an alerting system. This alert can be activated by setting the condition "Blockunity Rainbow Score (BRS)" and selecting "Any alert() function call". The alerts sent are as follows:- Buy and sell signals.
- Change from zone 9 to 10.
- Change from zone 8 to 9.
- Change from zone 3 to 2.
- Change from zone 2 to 1.
초대 전용 스크립트
이 스크립트는 작성자가 승인한 사용자만 접근할 수 있습니다. 사용하려면 요청 후 승인을 받아야 하며, 일반적으로 결제 후에 허가가 부여됩니다. 자세한 내용은 아래 작성자의 안내를 따르거나 Blockunity에게 직접 문의하세요.
이 비공개 초대 전용 스크립트는 스크립트 모더레이터의 검토를 거치지 않았으며, 하우스 룰 준수 여부는 확인되지 않았습니다. 트레이딩뷰는 스크립트의 작동 방식을 충분히 이해하고 작성자를 완전히 신뢰하지 않는 이상, 해당 스크립트에 비용을 지불하거나 사용하는 것을 권장하지 않습니다. 커뮤니티 스크립트에서 무료 오픈소스 대안을 찾아보실 수도 있습니다.
작성자 지시 사항
You can find all the information about the Rainbow Score here: https://unyx-data.com/rainbow-score/
Blockunity
app.blockunity.io/
unyx-data.com/
contact@blockunity.io
app.blockunity.io/
unyx-data.com/
contact@blockunity.io
면책사항
해당 정보와 게시물은 금융, 투자, 트레이딩 또는 기타 유형의 조언이나 권장 사항으로 간주되지 않으며, 트레이딩뷰에서 제공하거나 보증하는 것이 아닙니다. 자세한 내용은 이용 약관을 참조하세요.