OPEN-SOURCE SCRIPT
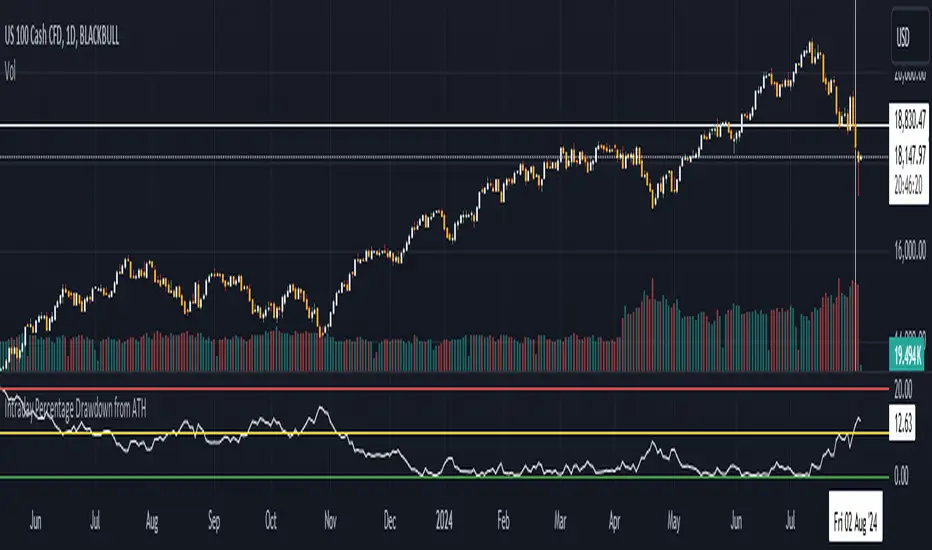
Intraday Percentage Drawdown from ATH
Track Intraday ATH:
The script maintains an intradayATH variable to track the highest price reached during the trading day up to the current point.
This variable is updated whenever a new high is reached.
Calculate Drawdown and Percentage Drawdown:
The drawdown is calculated as the difference between the intradayATH and the current closing price (close).
The percentage drawdown is calculated by dividing the drawdown by the intradayATH and multiplying by 100.
Plot Percentage Drawdown:
The percentageDrawdown is plotted on the chart with a red line to visually represent the drawdown from the intraday all-time high.
Draw Recession Line:
A horizontal red line is drawn at the 20.00 level, labeled "Recession". The line is styled as dotted and has a width of 2 for better visibility.
Draw Correction Line:
A horizontal yellow line is drawn at the 10.00 level, labeled "Correction". The line is styled as dotted and has a width of 2 for better visibility.
Draw All Time High Line:
A horizontal green line is drawn at the 0.0 level to represent the all-time high, labeled "All Time High". The line is styled as dotted and has a width of 2 for better visibility.
This script will display the percentage drawdown along with reference lines at 20% (recession), 10% (correction), and 0% (all-time high).
오픈 소스 스크립트
트레이딩뷰의 진정한 정신에 따라, 이 스크립트의 작성자는 이를 오픈소스로 공개하여 트레이더들이 기능을 검토하고 검증할 수 있도록 했습니다. 작성자에게 찬사를 보냅니다! 이 코드는 무료로 사용할 수 있지만, 코드를 재게시하는 경우 하우스 룰이 적용된다는 점을 기억하세요.
면책사항
해당 정보와 게시물은 금융, 투자, 트레이딩 또는 기타 유형의 조언이나 권장 사항으로 간주되지 않으며, 트레이딩뷰에서 제공하거나 보증하는 것이 아닙니다. 자세한 내용은 이용 약관을 참조하세요.
오픈 소스 스크립트
트레이딩뷰의 진정한 정신에 따라, 이 스크립트의 작성자는 이를 오픈소스로 공개하여 트레이더들이 기능을 검토하고 검증할 수 있도록 했습니다. 작성자에게 찬사를 보냅니다! 이 코드는 무료로 사용할 수 있지만, 코드를 재게시하는 경우 하우스 룰이 적용된다는 점을 기억하세요.
면책사항
해당 정보와 게시물은 금융, 투자, 트레이딩 또는 기타 유형의 조언이나 권장 사항으로 간주되지 않으며, 트레이딩뷰에서 제공하거나 보증하는 것이 아닙니다. 자세한 내용은 이용 약관을 참조하세요.