PROTECTED SOURCE SCRIPT
업데이트됨 CVDD + Terminal Price Indicator + Z-SCORE
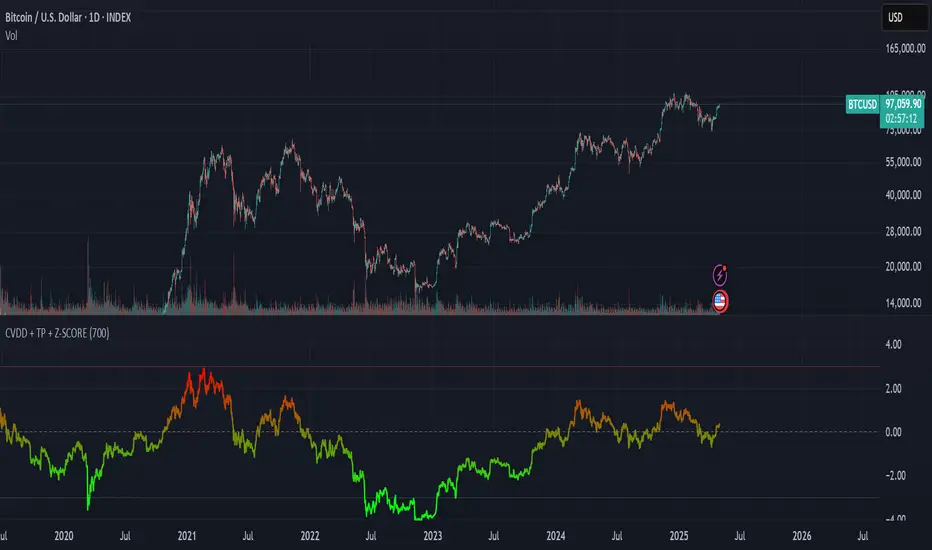
This custom indicator is designed to help identify major overvaluation and undervaluation zones in Bitcoin's market cycles by analyzing price behavior relative to long-term on-chain benchmarks.
It leverages two well-known valuation models — CVDD (Cumulative Value Days Destroyed) and Terminal Price — to define a dynamic valuation range that adapts over time. These reference points are combined with a custom Z-score framework to evaluate how extended price is compared to long-term value zones.
The result is a normalized oscillator that highlights extremes in market sentiment, ranging from –3 (potential deep value) to +3 (potential overheated conditions), with a gradient color scale for quick visual interpretation.
This tool is especially useful for long-term investors and macro analysts seeking signals of potential market tops and bottoms based on deep on-chain behavior — rather than short-term technicals.
릴리즈 노트
This custom indicator is designed to help identify major overvaluation and undervaluation zones in Bitcoin's market cycles by analyzing price behavior relative to long-term on-chain benchmarks.It leverages two well-known valuation models — CVDD (Cumulative Value Days Destroyed) and Terminal Price — to define a dynamic valuation range that adapts over time. These reference points are combined with a custom Z-score framework to evaluate how extended price is compared to long-term value zones.
The result is a normalized oscillator that highlights extremes in market sentiment, ranging from –3 (potential deep value) to +3 (potential overheated conditions), with a gradient color scale for quick visual interpretation.
This tool is especially useful for long-term investors and macro analysts seeking signals of potential market tops and bottoms based on deep on-chain behavior — rather than short-term technicals.
보호된 스크립트입니다
이 스크립트는 비공개 소스로 게시됩니다. 하지만 이를 자유롭게 제한 없이 사용할 수 있습니다 – 자세한 내용은 여기에서 확인하세요.
면책사항
해당 정보와 게시물은 금융, 투자, 트레이딩 또는 기타 유형의 조언이나 권장 사항으로 간주되지 않으며, 트레이딩뷰에서 제공하거나 보증하는 것이 아닙니다. 자세한 내용은 이용 약관을 참조하세요.
면책사항
해당 정보와 게시물은 금융, 투자, 트레이딩 또는 기타 유형의 조언이나 권장 사항으로 간주되지 않으며, 트레이딩뷰에서 제공하거나 보증하는 것이 아닙니다. 자세한 내용은 이용 약관을 참조하세요.