OPEN-SOURCE SCRIPT
업데이트됨 level_stats
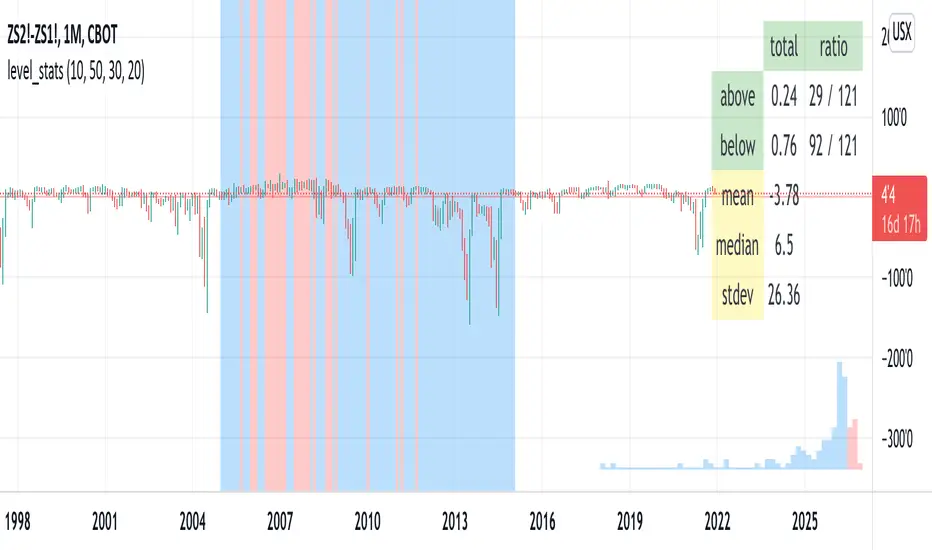
This script tells you the percentage of time an instrument's closing value is above and below a level of your choosing. The background color visually indicates periods where the instrument closed at or above the level (red) and below it (blue). For "stationary-ish" processes, you can get a loose feel for the mean, high, and low values. The historical information conveyed through the background coloring can help you plan derivatives trades. Try with your favorite pairs, commodities, or volatility indices.
Usage: pick a level of interest using the input.
Usage: pick a level of interest using the input.
릴리즈 노트
Added a histogram to depict the distribution of closing prices. Prices less than the "level" input are blue, while those above the level are red. This color scheme is also used to color the chart background.릴리즈 노트
removed some debug code릴리즈 노트
added mean, median, and stdev릴리즈 노트
Added a date selection. The statistics and histogram will reflect only the period [ start, end ).릴리즈 노트
added a horizontal line (light red) to indicate the level릴리즈 노트
The histogram's width, height, and number of buckets are now adjustable inputs. More buckets will make the histogram somewhat smoother and more detailed, but at the cost of performance. The maximum number of buckets is probably around 80. The width and height units are "percentage of the screen".I have set the defaults at levels that perform reasonably well.
오픈 소스 스크립트
트레이딩뷰의 진정한 정신에 따라, 이 스크립트의 작성자는 이를 오픈소스로 공개하여 트레이더들이 기능을 검토하고 검증할 수 있도록 했습니다. 작성자에게 찬사를 보냅니다! 이 코드는 무료로 사용할 수 있지만, 코드를 재게시하는 경우 하우스 룰이 적용된다는 점을 기억하세요.
면책사항
해당 정보와 게시물은 금융, 투자, 트레이딩 또는 기타 유형의 조언이나 권장 사항으로 간주되지 않으며, 트레이딩뷰에서 제공하거나 보증하는 것이 아닙니다. 자세한 내용은 이용 약관을 참조하세요.
오픈 소스 스크립트
트레이딩뷰의 진정한 정신에 따라, 이 스크립트의 작성자는 이를 오픈소스로 공개하여 트레이더들이 기능을 검토하고 검증할 수 있도록 했습니다. 작성자에게 찬사를 보냅니다! 이 코드는 무료로 사용할 수 있지만, 코드를 재게시하는 경우 하우스 룰이 적용된다는 점을 기억하세요.
면책사항
해당 정보와 게시물은 금융, 투자, 트레이딩 또는 기타 유형의 조언이나 권장 사항으로 간주되지 않으며, 트레이딩뷰에서 제공하거나 보증하는 것이 아닙니다. 자세한 내용은 이용 약관을 참조하세요.