PROTECTED SOURCE SCRIPT
Liquidity Zone Detector
Liquidity Zone Detector User Guide
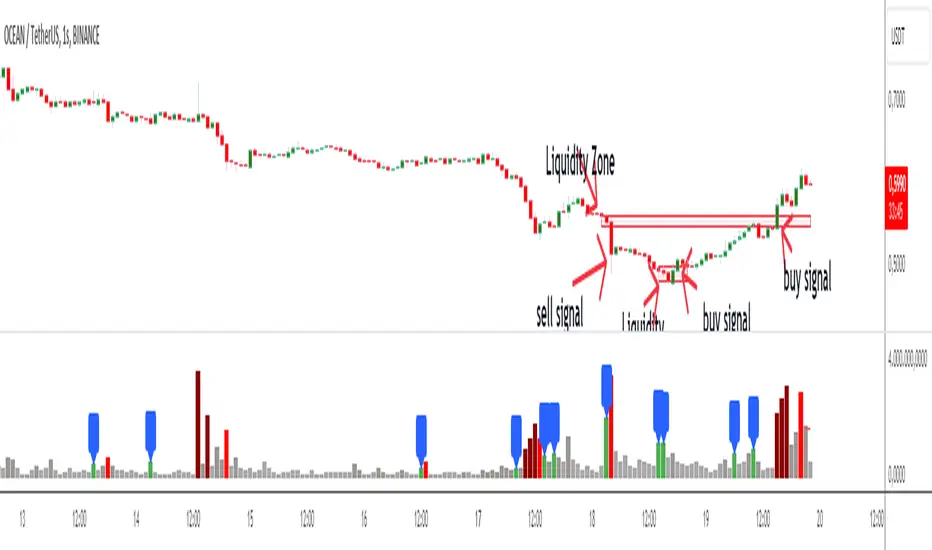
Liquidity Zone Detector is a powerful tool designed to identify high liquidity zones in the market. This indicator highlights areas where trading volume is significantly higher than average, but price movement remains limited. Such zones are often indicative of strong support or resistance levels, where substantial buying or selling activity occurs without a corresponding large price change.
Key Features:
Volume Analysis: Uses a configurable moving average to analyze volume and identify spikes in trading activity.
Body Length Analysis: Calculates the average body length of candlesticks to detect periods of low price movement.
Customizable Parameters: Adjust the analysis period, volume factor, and moving average length to suit your trading strategy.
Color-Coded Heatmap: Visualizes different volume levels with a gradient color scheme, from very low to peak volume.
Liquidity Highlight: Marks high liquidity zones with a distinct green color for easy identification.
How to Use:
1. Analysis Period
Setting: Analysis Period
Description: Sets the number of bars to use for calculating the average body length of candlesticks.
Recommendation: Use shorter periods (e.g., 10-20) for short-term analysis, and longer periods (e.g., 50-100) for long-term analysis.
2. Volume Factor
Setting: Volume Factor
Description: Determines the multiplier for average volume to identify high volume candles.
Recommendation: Start with values like 1.5-2.0 and adjust according to market conditions.
3. Volume Moving Average Length
Setting: Volume MA Length
Description: Sets the period for calculating the moving average of volume.
Recommendation: Use shorter periods (e.g., 20-50) for short-term analysis, and longer periods (e.g., 100-200) for long-term analysis.
4. Volume Factor Settings
Settings: Peak, High, Medium, Base Volume Factors
Description: Customizes thresholds for peak, high, medium, and base volume levels.
Recommendation: Start with default settings and adjust according to your trading strategy.
5. Visualization
Description: The indicator plots volume bars with color coding based on the configured thresholds. High liquidity zones are marked in green for quick recognition.
Recommendation: Configure the color coding and visualization options to suit your trading platform.
Conclusion
Liquidity Zone Detector is an essential tool for traders looking to spot potential areas of accumulation or distribution. It helps you make more informed decisions and enhances your overall trading performance.
보호된 스크립트입니다
이 스크립트는 비공개 소스로 게시됩니다. 하지만 이를 자유롭게 제한 없이 사용할 수 있습니다 – 자세한 내용은 여기에서 확인하세요.
면책사항
해당 정보와 게시물은 금융, 투자, 트레이딩 또는 기타 유형의 조언이나 권장 사항으로 간주되지 않으며, 트레이딩뷰에서 제공하거나 보증하는 것이 아닙니다. 자세한 내용은 이용 약관을 참조하세요.
보호된 스크립트입니다
이 스크립트는 비공개 소스로 게시됩니다. 하지만 이를 자유롭게 제한 없이 사용할 수 있습니다 – 자세한 내용은 여기에서 확인하세요.
면책사항
해당 정보와 게시물은 금융, 투자, 트레이딩 또는 기타 유형의 조언이나 권장 사항으로 간주되지 않으며, 트레이딩뷰에서 제공하거나 보증하는 것이 아닙니다. 자세한 내용은 이용 약관을 참조하세요.