PROTECTED SOURCE SCRIPT
업데이트됨 DCVIX
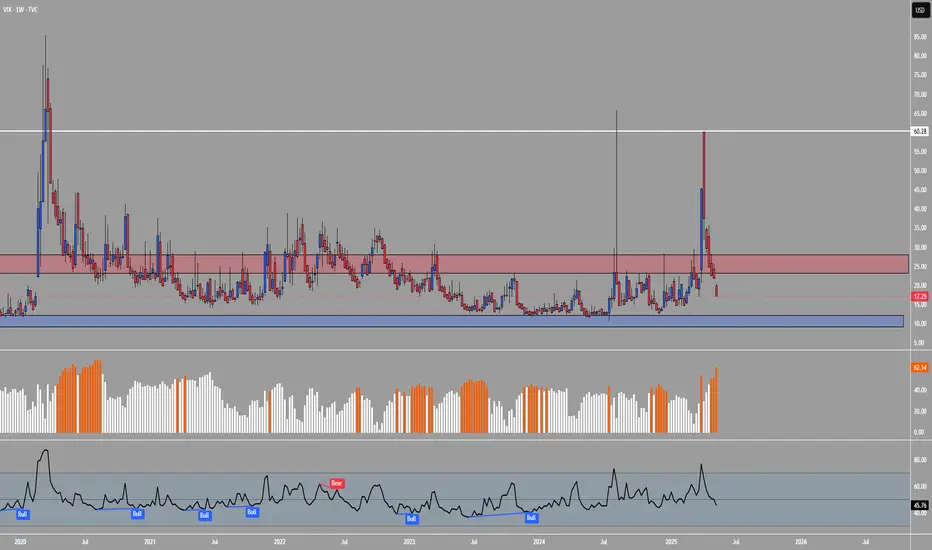
The DCVIX is a modified version of the Williams Vix Fix indicator.
It is a volatility based indicator based on Bollinger Bands and Standard Deviations. It is designed to assist you in identifying times of high and low volatility.
During times of high volatility (squeeze), price action often finds a local bottom. During times of low volatility, price action often finds a local top.
The DCVIX will print aqua bars on the histogram during times of high volatility (squeeze). This will assist you in identifying potential price action bottom.
The DCVIX also shows the changes in volatility based on the size of the bars. This may also assist you in identifying breakouts and even potential market tops.
This indicator is designed to be used in conjunction with other forms of confluence.
릴리즈 노트
Updated to V6보호된 스크립트입니다
이 스크립트는 비공개 소스로 게시됩니다. 하지만 이를 자유롭게 제한 없이 사용할 수 있습니다 – 자세한 내용은 여기에서 확인하세요.
면책사항
해당 정보와 게시물은 금융, 투자, 트레이딩 또는 기타 유형의 조언이나 권장 사항으로 간주되지 않으며, 트레이딩뷰에서 제공하거나 보증하는 것이 아닙니다. 자세한 내용은 이용 약관을 참조하세요.
보호된 스크립트입니다
이 스크립트는 비공개 소스로 게시됩니다. 하지만 이를 자유롭게 제한 없이 사용할 수 있습니다 – 자세한 내용은 여기에서 확인하세요.
면책사항
해당 정보와 게시물은 금융, 투자, 트레이딩 또는 기타 유형의 조언이나 권장 사항으로 간주되지 않으며, 트레이딩뷰에서 제공하거나 보증하는 것이 아닙니다. 자세한 내용은 이용 약관을 참조하세요.