OPEN-SOURCE SCRIPT
Tradytics Levels with EMA Cloud
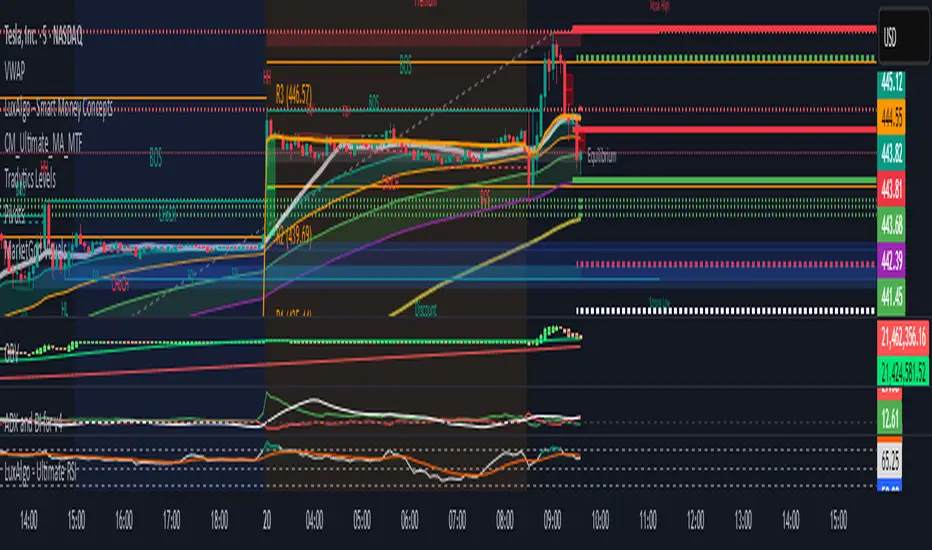
This indicator has tradytics price chart levels where you can put in the input code seen below.
The code has positive gamma (green lines), negative gamma (Red lines) and white dotted line are the darkpool levels.
This is Amazon's 5 minute from Sep30th to October 20th Gammas and weekly Darkpool levels. Just copy and paste code below in the input code and the chart would show the levels.
212.8*1*neutral 220.07*1*neutral 216.038*1*neutral 215.57*1*neutral 219.988*1*neutral 217.401*1*neutral 217.351*1*neutral 212.815*1*neutral 212.75*1*neutral 212.4*1*neutral 215*0*negative 222.5*0*positive 217.5*0*positive 220*0*positive
오픈 소스 스크립트
트레이딩뷰의 진정한 정신에 따라, 이 스크립트의 작성자는 이를 오픈소스로 공개하여 트레이더들이 기능을 검토하고 검증할 수 있도록 했습니다. 작성자에게 찬사를 보냅니다! 이 코드는 무료로 사용할 수 있지만, 코드를 재게시하는 경우 하우스 룰이 적용된다는 점을 기억하세요.
면책사항
해당 정보와 게시물은 금융, 투자, 트레이딩 또는 기타 유형의 조언이나 권장 사항으로 간주되지 않으며, 트레이딩뷰에서 제공하거나 보증하는 것이 아닙니다. 자세한 내용은 이용 약관을 참조하세요.
오픈 소스 스크립트
트레이딩뷰의 진정한 정신에 따라, 이 스크립트의 작성자는 이를 오픈소스로 공개하여 트레이더들이 기능을 검토하고 검증할 수 있도록 했습니다. 작성자에게 찬사를 보냅니다! 이 코드는 무료로 사용할 수 있지만, 코드를 재게시하는 경우 하우스 룰이 적용된다는 점을 기억하세요.
면책사항
해당 정보와 게시물은 금융, 투자, 트레이딩 또는 기타 유형의 조언이나 권장 사항으로 간주되지 않으며, 트레이딩뷰에서 제공하거나 보증하는 것이 아닙니다. 자세한 내용은 이용 약관을 참조하세요.