OPEN-SOURCE SCRIPT
D/W/M RSI & %CHNG + ATR
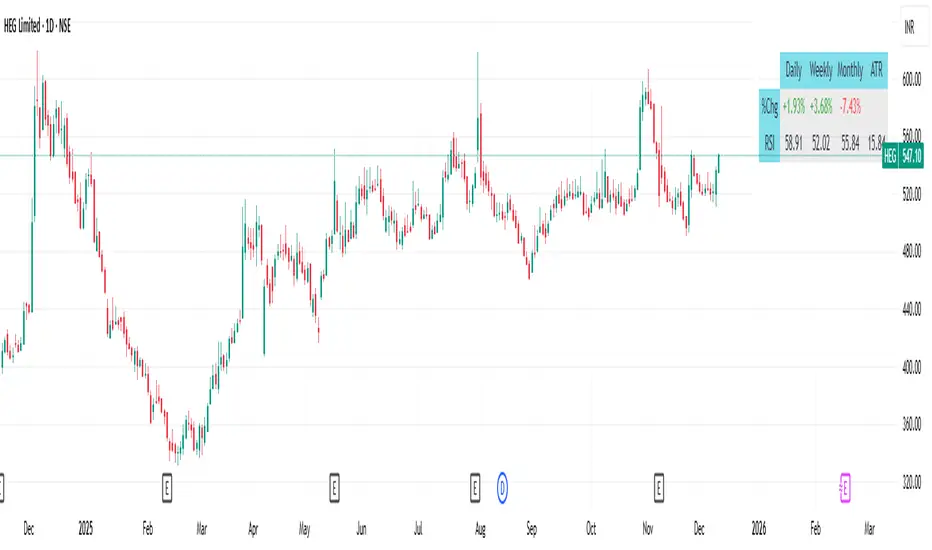
This indicator provides a comprehensive, at-a-glance dashboard displaying key technical metrics across multiple timeframes: Daily, Weekly, and Monthly. It tracks Price Change Percentage, Relative Strength Index (RSI), and Average True Range (ATR) for each timeframe, helping traders quickly assess market trends, momentum, and volatility in one view.
Key Features:
Price Change % (Daily/Weekly/Monthly):
Displays the percentage change in price over the selected timeframes, giving traders insight into short-term, medium-term, and long-term price movement trends.
Relative Strength Index (RSI):
Shows the RSI value on Daily, Weekly, and Monthly timeframes. The RSI measures momentum, indicating overbought or oversold conditions:
Average True Range (ATR):
Tracks the ATR across multiple timeframes to assess market volatility. Higher ATR values signify more significant price movement (higher volatility), while lower values suggest quieter markets.
This indicator helps traders make informed decisions by quickly visualizing price momentum, market volatility, and possible trend reversals. It's ideal for swing traders, day traders, and long-term investors who need a bird's-eye view of the market across different timeframes.
How to Use:
Add the indicator to your TradingView chart.
Review the Price Change % to see how the market is trending across the selected timeframes.
Use the RSI to identify overbought or oversold conditions.
Check the ATR to assess current market volatility and adjust position sizes accordingly.
오픈 소스 스크립트
트레이딩뷰의 진정한 정신에 따라, 이 스크립트의 작성자는 이를 오픈소스로 공개하여 트레이더들이 기능을 검토하고 검증할 수 있도록 했습니다. 작성자에게 찬사를 보냅니다! 이 코드는 무료로 사용할 수 있지만, 코드를 재게시하는 경우 하우스 룰이 적용된다는 점을 기억하세요.
면책사항
해당 정보와 게시물은 금융, 투자, 트레이딩 또는 기타 유형의 조언이나 권장 사항으로 간주되지 않으며, 트레이딩뷰에서 제공하거나 보증하는 것이 아닙니다. 자세한 내용은 이용 약관을 참조하세요.
오픈 소스 스크립트
트레이딩뷰의 진정한 정신에 따라, 이 스크립트의 작성자는 이를 오픈소스로 공개하여 트레이더들이 기능을 검토하고 검증할 수 있도록 했습니다. 작성자에게 찬사를 보냅니다! 이 코드는 무료로 사용할 수 있지만, 코드를 재게시하는 경우 하우스 룰이 적용된다는 점을 기억하세요.
면책사항
해당 정보와 게시물은 금융, 투자, 트레이딩 또는 기타 유형의 조언이나 권장 사항으로 간주되지 않으며, 트레이딩뷰에서 제공하거나 보증하는 것이 아닙니다. 자세한 내용은 이용 약관을 참조하세요.