OPEN-SOURCE SCRIPT
Momentum Arrows
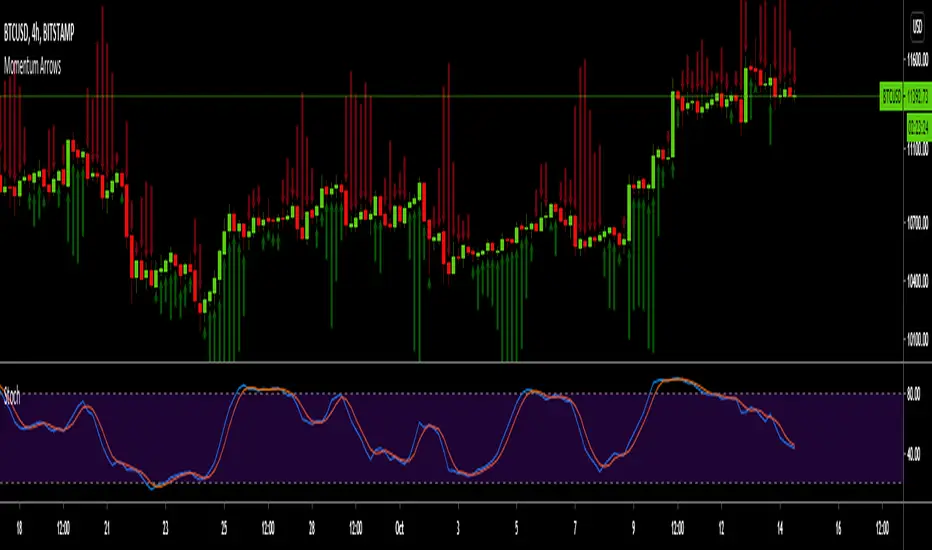
This simple indicators paints the Momentum based on Stochastic, RSI or WaveTrend onto the Price Chart by showing Green or Red arrows.
In the settings it can be selected which indicator is used, Stochastic is selected by default.
Length of the arrows is determined by the strength of the momentum:
Stochastic: Difference between D and K
RSI: Difference from RSI-50
WaveTrend: Difference between the Waves
(Thanks to LazyBear for the WaveTrend inspiration)
PS:
If anyone has an idea how to conditionally change the color of the arrows, then please let me know - that would be the icing on the cake. Then it would be possible to indicate Overbought/Oversold levels with different colors.
Unfortunately it currently seems not to be possible to dynamically change the arrow colour.
오픈 소스 스크립트
트레이딩뷰의 진정한 정신에 따라, 이 스크립트의 작성자는 이를 오픈소스로 공개하여 트레이더들이 기능을 검토하고 검증할 수 있도록 했습니다. 작성자에게 찬사를 보냅니다! 이 코드는 무료로 사용할 수 있지만, 코드를 재게시하는 경우 하우스 룰이 적용된다는 점을 기억하세요.
The new Order Block Finder V2 is available as invite-only script. Please visit the website for all the details and how to get access:
sites.google.com/view/wugamlo-indicators/
sites.google.com/view/wugamlo-indicators/
면책사항
해당 정보와 게시물은 금융, 투자, 트레이딩 또는 기타 유형의 조언이나 권장 사항으로 간주되지 않으며, 트레이딩뷰에서 제공하거나 보증하는 것이 아닙니다. 자세한 내용은 이용 약관을 참조하세요.