OPEN-SOURCE SCRIPT
[BCT] Can BTC be predicted or is it purely random?Variance Ratio
**This indicator can be applied to the ticker of your choice (not just BTC)**
Markets are said to be "efficient". An efficient market is by definition unpredictable - no matter the amount of ML, computation, or indicators thrown at it. In particular, in an efficient market, TA will not be of help.
An illustration of efficient markets is the WSJ's longstanding monkey vs. human contest:Blindfolded Monkey Beats Humans With Stock Picks, granted there are several flaws to it.
 BTC is a relatively new market. New markets are typically highly inefficient (easier to make money) and become more and more efficient over time (harder to make money). How much more efficient is BTC becoming?
We apply the Variance Ratio method and apply it to BTC.
BACKGROUND ON THE VARIANCE RATIO METHOD
Based on 1988 MacKinlay's seminal paper "Stock Market Prices do not Follow a Random Walk", the idea is to exploit a phenomenon called "variance scaling".
For those keen on looking into the math, the short version of it is under the assumption of iid (random walk) we have the following:
H0: Var(Sum(returns over K bars))=Sum(Var(returns over 1 bar))=k*Var(return over 1 bar)
We look to reject or not H0 depending on the observations.
In this script, we compare the variance of the (log) returns for the chart selected between:
(1) The (average) variance over k bars (call this Vk)
(2) The (average) variance over 1 bar (call this V1)
H0 simply says that Vk=k*V1 if the stock follows a random walk.
We compute the Variance Ratio VR(k)=Variance(returns over k bar)/(Sum(Var(returns over 1 bar)))-1
We then compute the associated Z-score which we chart out for a configurable k number of bars.
HOW TO INTERPRET THE CHART
The line drawn is the Z-Score for VR(k). It represents the number of standard deviations of VR(k) from 0 - the further out, the less random.
- If the line is close / hovers around 0, the ticker appears to follow a random walk (i.e. may not be predictable)
- If the line is consistently > 2 or <-2, the ticker likely does not follow a random walk (i.e. may have predictable features)
- If the line is positive, it means that the Variance on the k bars is larger than the variance on 1 bar (more variance on longer timeframes)
- If the line is negative, it means that the Variance on the k bars is smaller than the variance on 1 bar (more variance on smaller timeframes)
USE CASES
- Identify timeframes where you won't be able to make money
- Identify whether a stock cannot be predicted (forget about TA, indicators etc. -- a random walk is not predictable)
- Identify whether a stock is becoming less and less predictable (Z-score amplitude will decrease over time)
FEATURES
- select the number of K bar to compare vs. 1 bar (default = 16) - ideally a power of 2 but any other number will work. The chart is based off this selection
- select the lookback period for the analysis (500 bars by default)
- select the source to analyze (default = close, but you may select other inputs to calculate the returns from)
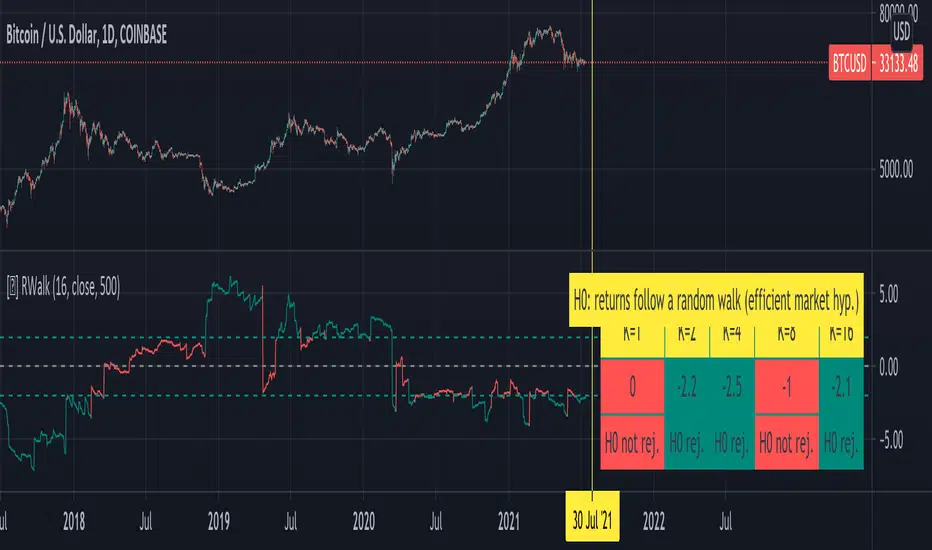
- results form the statistical tests on different K's in the table on the right/bottom side of the chart (H0 rejected = not random walk; H0 not rejected = it essentially looks rather random and we can't conclude that it's not a random walk)
COMMENTARY ON BTC
- It appears BTC's absolute value of the ZScore on the Variance Ratio is declining year after year - corroborating an increasingly efficient market as new participants join.
- However, we can still detect a fair amount of potential inefficiency using this simple test.
As usual, this is not investment advice. DYOR.
With love,
🐵BCT🐵
Markets are said to be "efficient". An efficient market is by definition unpredictable - no matter the amount of ML, computation, or indicators thrown at it. In particular, in an efficient market, TA will not be of help.
An illustration of efficient markets is the WSJ's longstanding monkey vs. human contest:Blindfolded Monkey Beats Humans With Stock Picks, granted there are several flaws to it.
We apply the Variance Ratio method and apply it to BTC.
BACKGROUND ON THE VARIANCE RATIO METHOD
Based on 1988 MacKinlay's seminal paper "Stock Market Prices do not Follow a Random Walk", the idea is to exploit a phenomenon called "variance scaling".
For those keen on looking into the math, the short version of it is under the assumption of iid (random walk) we have the following:
H0: Var(Sum(returns over K bars))=Sum(Var(returns over 1 bar))=k*Var(return over 1 bar)
We look to reject or not H0 depending on the observations.
In this script, we compare the variance of the (log) returns for the chart selected between:
(1) The (average) variance over k bars (call this Vk)
(2) The (average) variance over 1 bar (call this V1)
H0 simply says that Vk=k*V1 if the stock follows a random walk.
We compute the Variance Ratio VR(k)=Variance(returns over k bar)/(Sum(Var(returns over 1 bar)))-1
We then compute the associated Z-score which we chart out for a configurable k number of bars.
HOW TO INTERPRET THE CHART
The line drawn is the Z-Score for VR(k). It represents the number of standard deviations of VR(k) from 0 - the further out, the less random.
- If the line is close / hovers around 0, the ticker appears to follow a random walk (i.e. may not be predictable)
- If the line is consistently > 2 or <-2, the ticker likely does not follow a random walk (i.e. may have predictable features)
- If the line is positive, it means that the Variance on the k bars is larger than the variance on 1 bar (more variance on longer timeframes)
- If the line is negative, it means that the Variance on the k bars is smaller than the variance on 1 bar (more variance on smaller timeframes)
USE CASES
- Identify timeframes where you won't be able to make money
- Identify whether a stock cannot be predicted (forget about TA, indicators etc. -- a random walk is not predictable)
- Identify whether a stock is becoming less and less predictable (Z-score amplitude will decrease over time)
FEATURES
- select the number of K bar to compare vs. 1 bar (default = 16) - ideally a power of 2 but any other number will work. The chart is based off this selection
- select the lookback period for the analysis (500 bars by default)
- select the source to analyze (default = close, but you may select other inputs to calculate the returns from)
- results form the statistical tests on different K's in the table on the right/bottom side of the chart (H0 rejected = not random walk; H0 not rejected = it essentially looks rather random and we can't conclude that it's not a random walk)
COMMENTARY ON BTC
- It appears BTC's absolute value of the ZScore on the Variance Ratio is declining year after year - corroborating an increasingly efficient market as new participants join.
- However, we can still detect a fair amount of potential inefficiency using this simple test.
As usual, this is not investment advice. DYOR.
With love,
🐵BCT🐵
오픈 소스 스크립트
진정한 TradingView 정신에 따라, 이 스크립트의 저자는 트레이더들이 이해하고 검증할 수 있도록 오픈 소스로 공개했습니다. 저자에게 박수를 보냅니다! 이 코드는 무료로 사용할 수 있지만, 출판물에서 이 코드를 재사용하는 것은 하우스 룰에 의해 관리됩니다. 님은 즐겨찾기로 이 스크립트를 차트에서 쓸 수 있습니다.
[BCT]
면책사항
이 정보와 게시물은 TradingView에서 제공하거나 보증하는 금융, 투자, 거래 또는 기타 유형의 조언이나 권고 사항을 의미하거나 구성하지 않습니다. 자세한 내용은 이용 약관을 참고하세요.