OPEN-SOURCE SCRIPT
5-Min EMA Crossover (5/10)
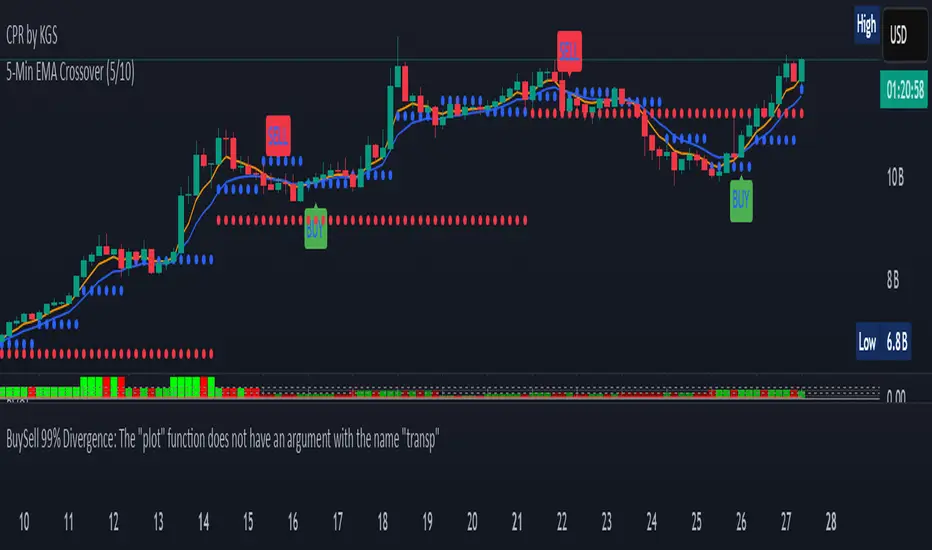
The 5-Minute EMA Crossover (5/10) strategy is a technical trading approach that uses two Exponential Moving Averages (EMAs) on a 5-minute chart to identify potential buy and sell signals based on trend shifts. Here's a description:
EMAs Used:
Fast EMA: 5-period EMA calculated on 5-minute candles. This EMA reacts quickly to recent price changes since it gives more weight to the latest data.
Slow EMA: 10-period EMA calculated on 5-minute candles. It responds more slowly, smoothing out short-term fluctuations.
How the Crossover Works:
A buy signal (long entry) occurs when the 5-period EMA crosses above the 10-period EMA. This suggests that recent price momentum is gaining strength upward, potentially indicating a bullish trend beginning or resuming.
A sell signal (short entry) happens when the 5-period EMA crosses below the 10-period EMA, signaling weakening recent price momentum and a possible bearish trend.
Purpose:
This crossover method helps traders catch short-term trends on a 5-minute timeframe by signaling moments when momentum shifts.
Because EMAs weight recent prices more heavily, the signals tend to be more responsive to fast market moves compared to simple moving averages.
Typical Usage:
Traders apply this to intraday charts (5-minute candles) looking for quick entries and exits.
It is common to use this crossover in combination with other indicators or price action context to reduce false signals.
Example of Signal Application:
When the 5 EMA crosses above the 10 EMA, consider entering a long position.
When the 5 EMA crosses below the 10 EMA, consider exiting longs or entering shorts.
This method leverages short-term momentum shifts visible on the 5-minute timeframe to help take advantage of intraday trends or reversals.
오픈 소스 스크립트
트레이딩뷰의 진정한 정신에 따라, 이 스크립트의 작성자는 이를 오픈소스로 공개하여 트레이더들이 기능을 검토하고 검증할 수 있도록 했습니다. 작성자에게 찬사를 보냅니다! 이 코드는 무료로 사용할 수 있지만, 코드를 재게시하는 경우 하우스 룰이 적용된다는 점을 기억하세요.
면책사항
해당 정보와 게시물은 금융, 투자, 트레이딩 또는 기타 유형의 조언이나 권장 사항으로 간주되지 않으며, 트레이딩뷰에서 제공하거나 보증하는 것이 아닙니다. 자세한 내용은 이용 약관을 참조하세요.
오픈 소스 스크립트
트레이딩뷰의 진정한 정신에 따라, 이 스크립트의 작성자는 이를 오픈소스로 공개하여 트레이더들이 기능을 검토하고 검증할 수 있도록 했습니다. 작성자에게 찬사를 보냅니다! 이 코드는 무료로 사용할 수 있지만, 코드를 재게시하는 경우 하우스 룰이 적용된다는 점을 기억하세요.
면책사항
해당 정보와 게시물은 금융, 투자, 트레이딩 또는 기타 유형의 조언이나 권장 사항으로 간주되지 않으며, 트레이딩뷰에서 제공하거나 보증하는 것이 아닙니다. 자세한 내용은 이용 약관을 참조하세요.