OPEN-SOURCE SCRIPT
업데이트됨 RSI-MFI Machine Learning [ Manhattan distance ]
The RSI-MFI Machine Learning Indicator is a technical analysis tool that combines the Relative Strength Index (RSI) and Money Flow Index (MFI) indicators with the Manhattan distance metric.
It aims to provide insights into potential trade setups by leveraging machine learning principles and calculating distances between current and historical data points.
The indicator starts by calculating the RSI and MFI values based on the specified periods for each indicator.
The RSI measures the strength and speed of price movements, while the MFI evaluates the inflow and outflow of money in the market.
By combining these two indicators, the indicator captures both price momentum and money flow dynamics.
To apply machine learning principles, the indicator utilizes the Manhattan distance metric to quantify the similarity or dissimilarity between different data points.
The Manhattan distance is calculated by taking the absolute differences between corresponding RSI and MFI values of the current point and historical points.
Next, the indicator determines the nearest neighbors based on the calculated Manhattan distances.
The number of nearest neighbors is determined by the square root of the specified count of neighbors.
By identifying similar patterns and behaviors in the historical data, the indicator aims to uncover potential trade opportunities.
Trade signals are generated based on the calculated distances. The indicator compares each distance with the maximum distance encountered so far.
If a new maximum distance is found, it updates the value and considers the corresponding direction as a potential trade signal. The trade signals are stored in an array for further analysis.
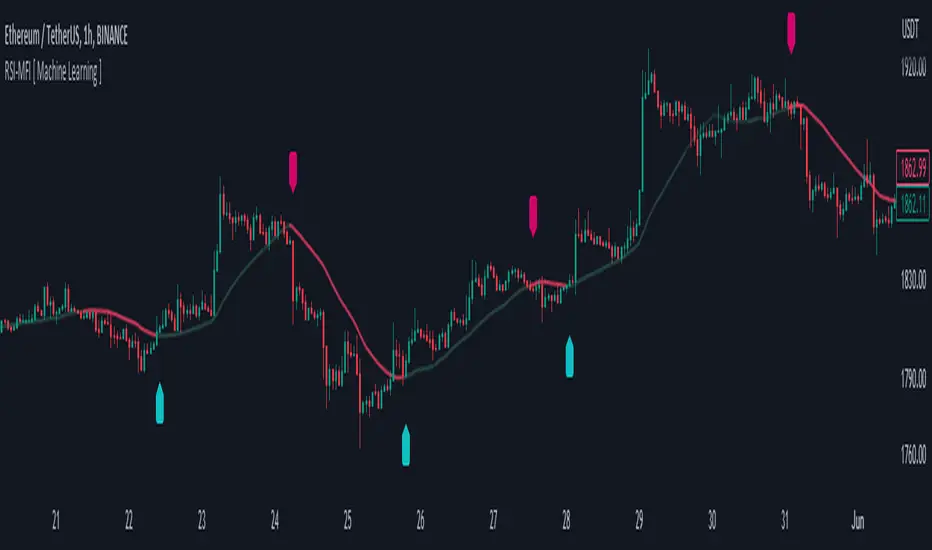
Furthermore, the indicator considers the price action and a calculated regression line to differentiate between long and short trade signals.
The RSI-MFI Machine Learning Indicator visualizes the regression line on the price chart and labels the bars accordingly. It highlights the regression line with different colors based on the trade signals, making it easier for traders to identify potential entry or exit points.
Traders can use the RSI-MFI Machine Learning Indicator as a tool to analyze price movements, evaluate market conditions based on RSI and MFI, leverage machine learning concepts to find similar patterns, and make informed trading decisions.
It aims to provide insights into potential trade setups by leveraging machine learning principles and calculating distances between current and historical data points.
The indicator starts by calculating the RSI and MFI values based on the specified periods for each indicator.
The RSI measures the strength and speed of price movements, while the MFI evaluates the inflow and outflow of money in the market.
By combining these two indicators, the indicator captures both price momentum and money flow dynamics.
To apply machine learning principles, the indicator utilizes the Manhattan distance metric to quantify the similarity or dissimilarity between different data points.
The Manhattan distance is calculated by taking the absolute differences between corresponding RSI and MFI values of the current point and historical points.
Next, the indicator determines the nearest neighbors based on the calculated Manhattan distances.
The number of nearest neighbors is determined by the square root of the specified count of neighbors.
By identifying similar patterns and behaviors in the historical data, the indicator aims to uncover potential trade opportunities.
Trade signals are generated based on the calculated distances. The indicator compares each distance with the maximum distance encountered so far.
If a new maximum distance is found, it updates the value and considers the corresponding direction as a potential trade signal. The trade signals are stored in an array for further analysis.
Furthermore, the indicator considers the price action and a calculated regression line to differentiate between long and short trade signals.
- Long trade signals are identified when the closing price is above the regression line, indicating a potentially bullish setup.
- Short trade signals are identified when the closing price is below the regression line, indicating a potentially bearish setup.
The RSI-MFI Machine Learning Indicator visualizes the regression line on the price chart and labels the bars accordingly. It highlights the regression line with different colors based on the trade signals, making it easier for traders to identify potential entry or exit points.
Traders can use the RSI-MFI Machine Learning Indicator as a tool to analyze price movements, evaluate market conditions based on RSI and MFI, leverage machine learning concepts to find similar patterns, and make informed trading decisions.
릴리즈 노트
Minor changes릴리즈 노트
Alerts Added ( Buy & Sell )오픈 소스 스크립트
트레이딩뷰의 진정한 정신에 따라, 이 스크립트의 작성자는 이를 오픈소스로 공개하여 트레이더들이 기능을 검토하고 검증할 수 있도록 했습니다. 작성자에게 찬사를 보냅니다! 이 코드는 무료로 사용할 수 있지만, 코드를 재게시하는 경우 하우스 룰이 적용된다는 점을 기억하세요.
Links : linktr.ee/tzacks
면책사항
해당 정보와 게시물은 금융, 투자, 트레이딩 또는 기타 유형의 조언이나 권장 사항으로 간주되지 않으며, 트레이딩뷰에서 제공하거나 보증하는 것이 아닙니다. 자세한 내용은 이용 약관을 참조하세요.
오픈 소스 스크립트
트레이딩뷰의 진정한 정신에 따라, 이 스크립트의 작성자는 이를 오픈소스로 공개하여 트레이더들이 기능을 검토하고 검증할 수 있도록 했습니다. 작성자에게 찬사를 보냅니다! 이 코드는 무료로 사용할 수 있지만, 코드를 재게시하는 경우 하우스 룰이 적용된다는 점을 기억하세요.
Links : linktr.ee/tzacks
면책사항
해당 정보와 게시물은 금융, 투자, 트레이딩 또는 기타 유형의 조언이나 권장 사항으로 간주되지 않으며, 트레이딩뷰에서 제공하거나 보증하는 것이 아닙니다. 자세한 내용은 이용 약관을 참조하세요.