OPEN-SOURCE SCRIPT
Wick Strength [MS]
Overview
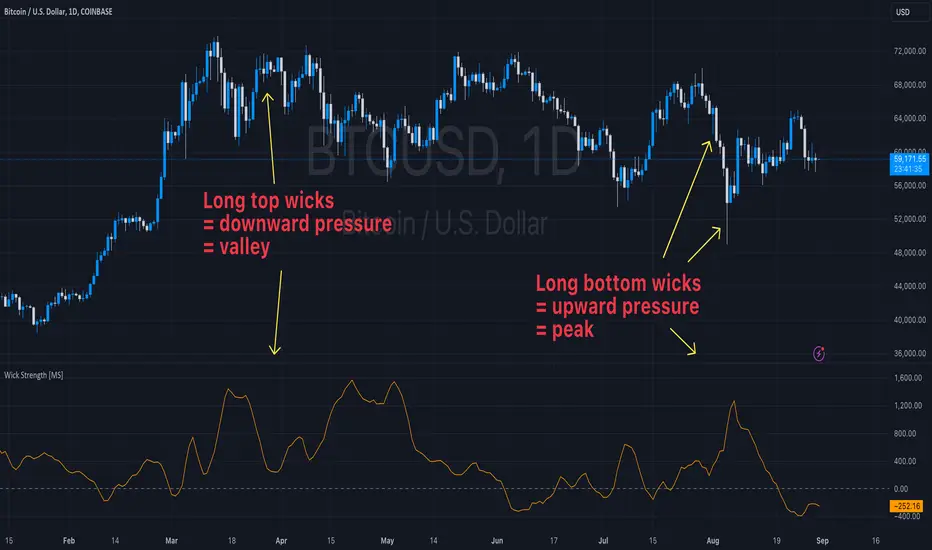
The Wick Strength indicator is a unique script designed to measure and visualize the relative strength of candlestick wicks over time. By analyzing the relationship between upper and lower wicks, this indicator provides insights into potential market dynamics and price action patterns.
How It Works
The Wick Strength indicator calculates the "strength" of candlestick wicks by comparing the upward and downward movements within each candle's range. This calculation results in a dynamic line plot that represents the evolving wick strength across your chosen timeframe.
Strength is not range-bound, allowing the score to reach extremes and be compared relatively across time.
Interpretation
Key Features
Measures relative wick strength candle by candle
Smooths the values by summation based on user preference
Adaptable to all timeframes and markets
Potential Applications
While extensive backtesting has not been performed, the Wick Strength indicator may offer valuable insights for:
The Wick Strength indicator is a unique script designed to measure and visualize the relative strength of candlestick wicks over time. By analyzing the relationship between upper and lower wicks, this indicator provides insights into potential market dynamics and price action patterns.
How It Works
The Wick Strength indicator calculates the "strength" of candlestick wicks by comparing the upward and downward movements within each candle's range. This calculation results in a dynamic line plot that represents the evolving wick strength across your chosen timeframe.
Strength is not range-bound, allowing the score to reach extremes and be compared relatively across time.
Interpretation
- Positive values indicate stronger upper wicks (potential bearish pressure)
- Negative values suggest stronger lower wicks (potential bullish pressure)
- Extreme readings might signal overextended moves or potential reversals
Key Features
Measures relative wick strength candle by candle
Smooths the values by summation based on user preference
Adaptable to all timeframes and markets
Potential Applications
While extensive backtesting has not been performed, the Wick Strength indicator may offer valuable insights for:
- Identifying potential divergences between price action and wick strength
- Spotting changes in market sentiment or volatility
- Complementing other technical analysis tools for a more comprehensive trading approach
- Developing unique trading strategies based on wick behavior
오픈 소스 스크립트
트레이딩뷰의 진정한 정신에 따라, 이 스크립트의 작성자는 이를 오픈소스로 공개하여 트레이더들이 기능을 검토하고 검증할 수 있도록 했습니다. 작성자에게 찬사를 보냅니다! 이 코드는 무료로 사용할 수 있지만, 코드를 재게시하는 경우 하우스 룰이 적용된다는 점을 기억하세요.
For script access or PineScript questions, please visit our site:
marketscripters.com?utm_source=tradingview&utm_medium=signature
marketscripters.com?utm_source=tradingview&utm_medium=signature
면책사항
해당 정보와 게시물은 금융, 투자, 트레이딩 또는 기타 유형의 조언이나 권장 사항으로 간주되지 않으며, 트레이딩뷰에서 제공하거나 보증하는 것이 아닙니다. 자세한 내용은 이용 약관을 참조하세요.