INVITE-ONLY SCRIPT
NVME Candles Creator Experimental
//Note://
This is an experimental indicator that may provide you with useful information or it may not depending on how you use it and more information can be found below!
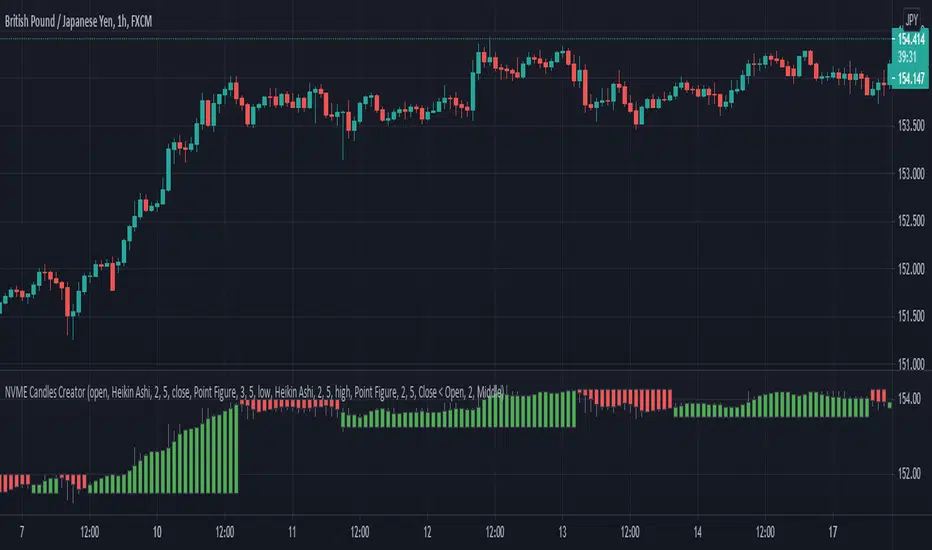
NVME Candle Creator indicator is an experimental indicator that allows you as the user to build your own candlestick system within a click of a button. The indicator uses data from 5 different chart series including the following: The default candle stick, Heikin Ashi, Renko (ATR Version), Kagi and the Point and Figure chart. Since there are 4 pieces of data from a candle plot such as the open, the close, the high and the low, we are able to edit each individually with our own data using the security() function and the chart series functions that are linked to the those specific charts. This indicator is designed to be used as a second chart alternative without having to take much screen space, however there are other uses to it such as using this indicator to find information about other chart types and possibly creating a noise free chart series using our integrated colour scheme system.
The features of this indicator are the following:
Sources (1-4) : These are customisable by changing the item listed on the drop down menu, the items displayed will be data from the charts such as open, close, high, low, hl2, hl3, and ohcl etc. There are 4 of these inputs as this will change the data that you are grabbing for the series. (Series 1 -> Close, Series 2 -> Open, Series 3 -> High, Series 4 -> Low)
Candle Style (1-4) : This is the chart series we will be using to get the final output of the indicator, this can be changed by selecting a different item in the dropdown menu. The following content of this drop down menu are: Default (Japanese Candlesticks), Heikin Ashi Candlesticks, ATR (Renko Version), Kagi and Point and Figure. These will strongly determine the final output of the indicator as they can change what data will be represented and how it will be displayed.
Length (1-4) : The value in this input field only affects the following candle style options: ATR, Kagi and Point and Figure. The reason is because these chart series include a customisable input in the form of reversal points or ATR value. Changing this value will determine the final design of the indicator as it can make the candles larger or smaller depending on the number inside the box.
Custom Timeframe (1-4) : This toggle will allow you to fetch data from a different timeframe of choice, however disabling this will fetch data from the current timeframe period.
Timeframe Value (1-4) : This input field is only active when the custom timeframe is enabled and this will change the security function so that it grabs data from the timeframe inputted and this can change the indicator's output so that the candles will look different but it doesn't have a significant change compared to the candle style feature.
Colour Filter: (Affects the candles plotted)
Option 1: "Close > Open" - Recolours the candles in a manner where candles will be green if that candle is greater than the open and the candles will be red if the close is less than the open.
Option 2: "Close < Open" - Recolours the candles in a manner where candles will be red if that candle is greater than the open and the candles will be green if the close is less than the open. (May be useful for some settings where the plots are different) - Use this as a colour correction.
Option 3: "None" - The colours will be removed so you will have to manually change it.
Dashboard: This can be turned off or turned on however it doesn't contain anything useful only a reminder that it isn't recommended to use this indicator alone as it is designed as an experimental indicator.
This is an experimental indicator that may provide you with useful information or it may not depending on how you use it and more information can be found below!
NVME Candle Creator indicator is an experimental indicator that allows you as the user to build your own candlestick system within a click of a button. The indicator uses data from 5 different chart series including the following: The default candle stick, Heikin Ashi, Renko (ATR Version), Kagi and the Point and Figure chart. Since there are 4 pieces of data from a candle plot such as the open, the close, the high and the low, we are able to edit each individually with our own data using the security() function and the chart series functions that are linked to the those specific charts. This indicator is designed to be used as a second chart alternative without having to take much screen space, however there are other uses to it such as using this indicator to find information about other chart types and possibly creating a noise free chart series using our integrated colour scheme system.
The features of this indicator are the following:
Sources (1-4) : These are customisable by changing the item listed on the drop down menu, the items displayed will be data from the charts such as open, close, high, low, hl2, hl3, and ohcl etc. There are 4 of these inputs as this will change the data that you are grabbing for the series. (Series 1 -> Close, Series 2 -> Open, Series 3 -> High, Series 4 -> Low)
Candle Style (1-4) : This is the chart series we will be using to get the final output of the indicator, this can be changed by selecting a different item in the dropdown menu. The following content of this drop down menu are: Default (Japanese Candlesticks), Heikin Ashi Candlesticks, ATR (Renko Version), Kagi and Point and Figure. These will strongly determine the final output of the indicator as they can change what data will be represented and how it will be displayed.
Length (1-4) : The value in this input field only affects the following candle style options: ATR, Kagi and Point and Figure. The reason is because these chart series include a customisable input in the form of reversal points or ATR value. Changing this value will determine the final design of the indicator as it can make the candles larger or smaller depending on the number inside the box.
Custom Timeframe (1-4) : This toggle will allow you to fetch data from a different timeframe of choice, however disabling this will fetch data from the current timeframe period.
Timeframe Value (1-4) : This input field is only active when the custom timeframe is enabled and this will change the security function so that it grabs data from the timeframe inputted and this can change the indicator's output so that the candles will look different but it doesn't have a significant change compared to the candle style feature.
Colour Filter: (Affects the candles plotted)
Option 1: "Close > Open" - Recolours the candles in a manner where candles will be green if that candle is greater than the open and the candles will be red if the close is less than the open.
Option 2: "Close < Open" - Recolours the candles in a manner where candles will be red if that candle is greater than the open and the candles will be green if the close is less than the open. (May be useful for some settings where the plots are different) - Use this as a colour correction.
Option 3: "None" - The colours will be removed so you will have to manually change it.
Dashboard: This can be turned off or turned on however it doesn't contain anything useful only a reminder that it isn't recommended to use this indicator alone as it is designed as an experimental indicator.
초대 전용 스크립트
이 스크립트는 작성자가 승인한 사용자만 접근할 수 있습니다. 사용하려면 요청 후 승인을 받아야 하며, 일반적으로 결제 후에 허가가 부여됩니다. 자세한 내용은 아래 작성자의 안내를 따르거나 Crypto_Samm에게 직접 문의하세요.
트레이딩뷰는 스크립트의 작동 방식을 충분히 이해하고 작성자를 완전히 신뢰하지 않는 이상, 해당 스크립트에 비용을 지불하거나 사용하는 것을 권장하지 않습니다. 커뮤니티 스크립트에서 무료 오픈소스 대안을 찾아보실 수도 있습니다.
작성자 지시 사항
You will be granted access on TradingView within 2-8 hours after you purchase on our website: https://www.nvmetrading.com We advise you to take a look at our product and discord group before considering using our services! Docs + discord in our website!
Visit our website to get access: nvmetrading.com
You can also find videos, images, documentation and other resources there too.
Join Our Discord: discord.gg/2CY7BYTySR
You can also find videos, images, documentation and other resources there too.
Join Our Discord: discord.gg/2CY7BYTySR
면책사항
해당 정보와 게시물은 금융, 투자, 트레이딩 또는 기타 유형의 조언이나 권장 사항으로 간주되지 않으며, 트레이딩뷰에서 제공하거나 보증하는 것이 아닙니다. 자세한 내용은 이용 약관을 참조하세요.