OPEN-SOURCE SCRIPT
업데이트됨 Enterprise Value on Earnings / FCF / FFO Band
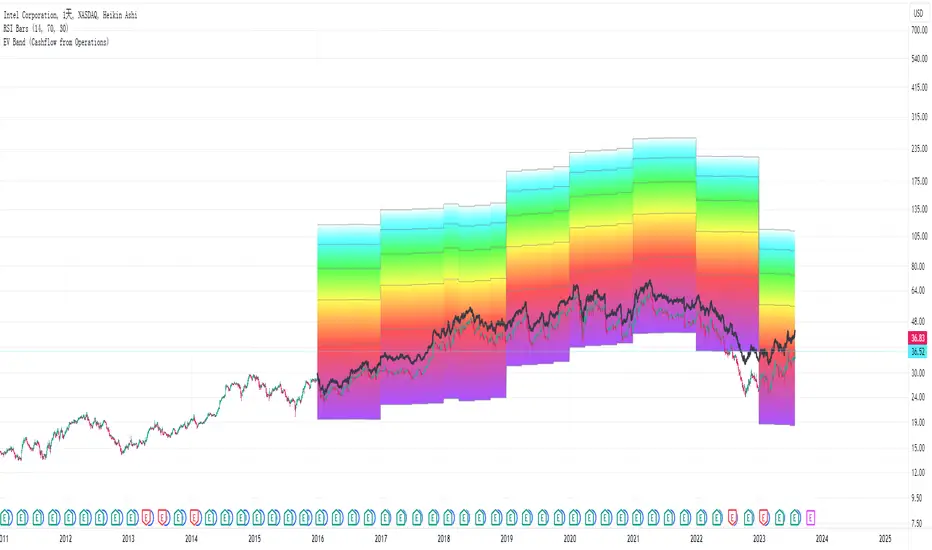
Enterprise Value per Diluted Share plotted as black line.
Bands start at 5x and stops at 30x, each represents a 5x increment.
Band Options (per Diluted Share, Fiscal Year):
①Free Cash Flow
②Operating Income
③Adjusted Funds from Operations
④Core Earnings
where:
These two adjustments are coarse and watered-down, so take them with a grain of salt.
For professional assessments of Core Earnings versus GAAP Earnings you may go to David Trainer at Great Speculations(costs money). I am unaffiliated with these entities.
Tips:
Disclaimer: Use at your own discretion. No guarantees for any accuracy or usefulness. If you decide to use it, I take no responsibility whatsoever for any consequences. Does not constitute financial advice. Past performance is not Indicative of future results.
Bands start at 5x and stops at 30x, each represents a 5x increment.
Band Options (per Diluted Share, Fiscal Year):
①Free Cash Flow
②Operating Income
③Adjusted Funds from Operations
④Core Earnings
where:
- AFfO = FFO - Unusual Income/Expenses + Tax Distortion (dafault 25% tax rate)
- Core Earnings = Net Income - Unusual Income/Expenses + Tax Distortion (default 25% tax rate)
These two adjustments are coarse and watered-down, so take them with a grain of salt.
For professional assessments of Core Earnings versus GAAP Earnings you may go to David Trainer at Great Speculations(costs money). I am unaffiliated with these entities.
Tips:
- ①③ are unapplicable to financials.
- ③ may work for REIT-like companies whose depreciation is mostly overstated(e.g. hydro-elec utility companies whose dams typically don't wear out in ten years; companies with assets that APPRECIATE in reality but they D&A them anyway).
- Probably none works for cyclicals, especially extreme boom-bust cyclicals such as oil, aluminum & shipping etc.
- Beware unnaturally low (dividend_payout+buyback)/net_income ratio as some majority shareholders may funnel money to themselves/cronies at the expense of small shareholders.
Disclaimer: Use at your own discretion. No guarantees for any accuracy or usefulness. If you decide to use it, I take no responsibility whatsoever for any consequences. Does not constitute financial advice. Past performance is not Indicative of future results.
릴리즈 노트
Added Cashflow from Operations option.릴리즈 노트
Changed most data timeframes from Fiscal Year to Trailing Twelve Months.Added EBITDA option. EBITDA is more useful for heavily indebted companies. The basic idea is that interest payments act as a tax shield but when leverage gets too high financing costs(credit spread) will go up. Interest rate going up or tax rate going down will also lower the optimal leverage ratio for tax shield. Do note that it shares the same pitfalls with most non-cash metrics: high sustaining CapEx, accounts "un"receivable, etc. As such, it is best to be used to compare companies within the same industry or when you are sure a company is purely cash flow based, the prime example being tobacco companies.
오픈 소스 스크립트
트레이딩뷰의 진정한 정신에 따라, 이 스크립트의 작성자는 이를 오픈소스로 공개하여 트레이더들이 기능을 검토하고 검증할 수 있도록 했습니다. 작성자에게 찬사를 보냅니다! 이 코드는 무료로 사용할 수 있지만, 코드를 재게시하는 경우 하우스 룰이 적용된다는 점을 기억하세요.
면책사항
해당 정보와 게시물은 금융, 투자, 트레이딩 또는 기타 유형의 조언이나 권장 사항으로 간주되지 않으며, 트레이딩뷰에서 제공하거나 보증하는 것이 아닙니다. 자세한 내용은 이용 약관을 참조하세요.
오픈 소스 스크립트
트레이딩뷰의 진정한 정신에 따라, 이 스크립트의 작성자는 이를 오픈소스로 공개하여 트레이더들이 기능을 검토하고 검증할 수 있도록 했습니다. 작성자에게 찬사를 보냅니다! 이 코드는 무료로 사용할 수 있지만, 코드를 재게시하는 경우 하우스 룰이 적용된다는 점을 기억하세요.
면책사항
해당 정보와 게시물은 금융, 투자, 트레이딩 또는 기타 유형의 조언이나 권장 사항으로 간주되지 않으며, 트레이딩뷰에서 제공하거나 보증하는 것이 아닙니다. 자세한 내용은 이용 약관을 참조하세요.