OPEN-SOURCE SCRIPT
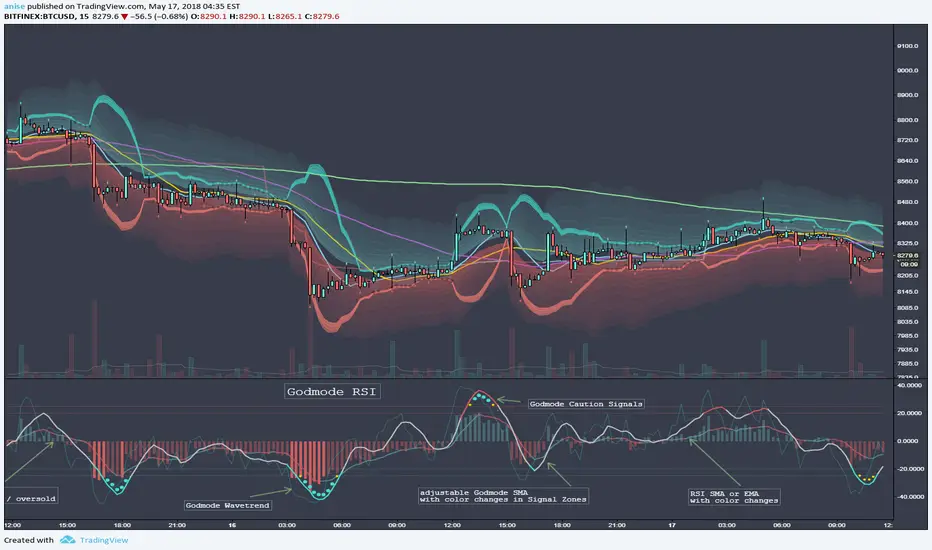
Godmode RSI

based on the popular Godmode Indicator with modifications by LEGION, LAZYBEAR, Ni6HTH4wK, xSilas, oh92, sco77m4r7in
All Credit belongs to them. THX Guys!
This is a Combination of a RSI and Godmode.
RSI has a Simple or Exponential Moving Average, Histogram Color Changes when the RSI reaches the Overbought/Oversold Zones.
Godmode is basicly the same as the Original one only scaled down a bit with slightly adjusted Caution Signal Zones which i like more. I also added the Option to adjust the Length of the 2nd Wavetrend SMA. Removed the Wavetrend Area because it doesnt have any use for me.
Hope you like it.
오픈 소스 스크립트
트레이딩뷰의 진정한 정신에 따라, 이 스크립트의 작성자는 이를 오픈소스로 공개하여 트레이더들이 기능을 검토하고 검증할 수 있도록 했습니다. 작성자에게 찬사를 보냅니다! 이 코드는 무료로 사용할 수 있지만, 코드를 재게시하는 경우 하우스 룰이 적용된다는 점을 기억하세요.
면책사항
해당 정보와 게시물은 금융, 투자, 트레이딩 또는 기타 유형의 조언이나 권장 사항으로 간주되지 않으며, 트레이딩뷰에서 제공하거나 보증하는 것이 아닙니다. 자세한 내용은 이용 약관을 참조하세요.
오픈 소스 스크립트
트레이딩뷰의 진정한 정신에 따라, 이 스크립트의 작성자는 이를 오픈소스로 공개하여 트레이더들이 기능을 검토하고 검증할 수 있도록 했습니다. 작성자에게 찬사를 보냅니다! 이 코드는 무료로 사용할 수 있지만, 코드를 재게시하는 경우 하우스 룰이 적용된다는 점을 기억하세요.
면책사항
해당 정보와 게시물은 금융, 투자, 트레이딩 또는 기타 유형의 조언이나 권장 사항으로 간주되지 않으며, 트레이딩뷰에서 제공하거나 보증하는 것이 아닙니다. 자세한 내용은 이용 약관을 참조하세요.