OPEN-SOURCE SCRIPT
업데이트됨 Flat Numbers
Customizable Price Range: Set the start price and end price to define the range in which horizontal lines will be plotted.
Line Color: Choose the color of the horizontal lines to match your chart's theme or personal preference.
Line Width: Adjust the width of the lines (from 1 to 5) to control their visibility.
Price Step Size: By default, the script plots lines every 100 price units within the range, but this step size can be customized if desired.
Dynamic Line Plotting: The script automatically calculates the number of lines needed and plots them at each interval between the start and end prices.
릴리즈 노트
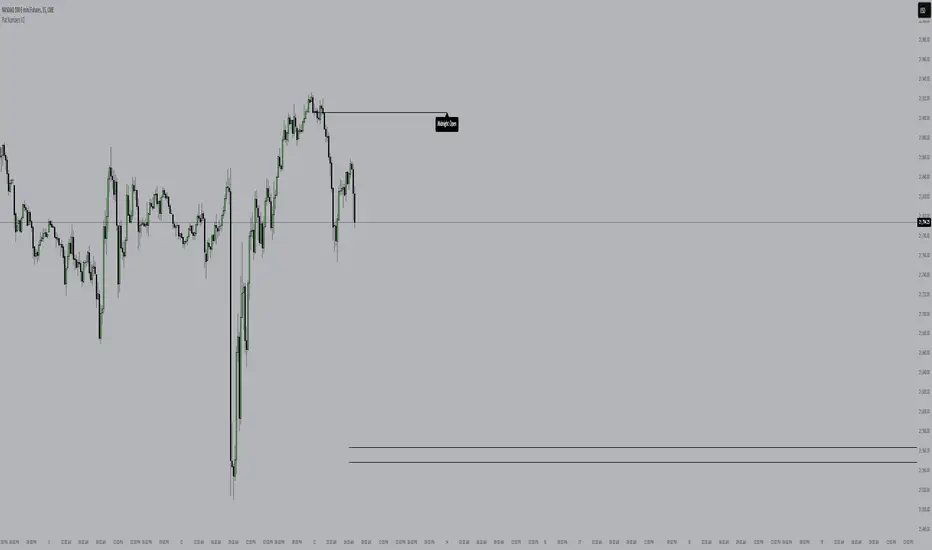
This script draws two lines on a chart:1. **Price Range Lines**: It lets you define a start and end price, then draws horizontal lines at every 100 price units in between.
2. **Opening Lines**: It draws two lines:
- One for the **Midnight Open** (00:00 NY time)
- One for the **08:30 Open** (NY time)
You can customize the color, style, and width of these lines, and optionally add labels showing "Midnight Open" or "08:30 Open". You can also choose the timezone.
In short: It helps visualize key price levels (range) and opening times with customizable lines and labels.
릴리즈 노트
added 830am range 오픈 소스 스크립트
트레이딩뷰의 진정한 정신에 따라, 이 스크립트의 작성자는 이를 오픈소스로 공개하여 트레이더들이 기능을 검토하고 검증할 수 있도록 했습니다. 작성자에게 찬사를 보냅니다! 이 코드는 무료로 사용할 수 있지만, 코드를 재게시하는 경우 하우스 룰이 적용된다는 점을 기억하세요.
면책사항
해당 정보와 게시물은 금융, 투자, 트레이딩 또는 기타 유형의 조언이나 권장 사항으로 간주되지 않으며, 트레이딩뷰에서 제공하거나 보증하는 것이 아닙니다. 자세한 내용은 이용 약관을 참조하세요.
오픈 소스 스크립트
트레이딩뷰의 진정한 정신에 따라, 이 스크립트의 작성자는 이를 오픈소스로 공개하여 트레이더들이 기능을 검토하고 검증할 수 있도록 했습니다. 작성자에게 찬사를 보냅니다! 이 코드는 무료로 사용할 수 있지만, 코드를 재게시하는 경우 하우스 룰이 적용된다는 점을 기억하세요.
면책사항
해당 정보와 게시물은 금융, 투자, 트레이딩 또는 기타 유형의 조언이나 권장 사항으로 간주되지 않으며, 트레이딩뷰에서 제공하거나 보증하는 것이 아닙니다. 자세한 내용은 이용 약관을 참조하세요.