OPEN-SOURCE SCRIPT
Tick Time/Speed
The Tick Time/Speed indicator highlights the latest TradingView feature, Tick Charts (beta), and aims to provide a visual representation of the speed.
🔶 USAGE

1-minute chart
Unlike regular charts, where the time difference between two bars is relatively equal, the time difference between two tick bars can vary.

1T chart


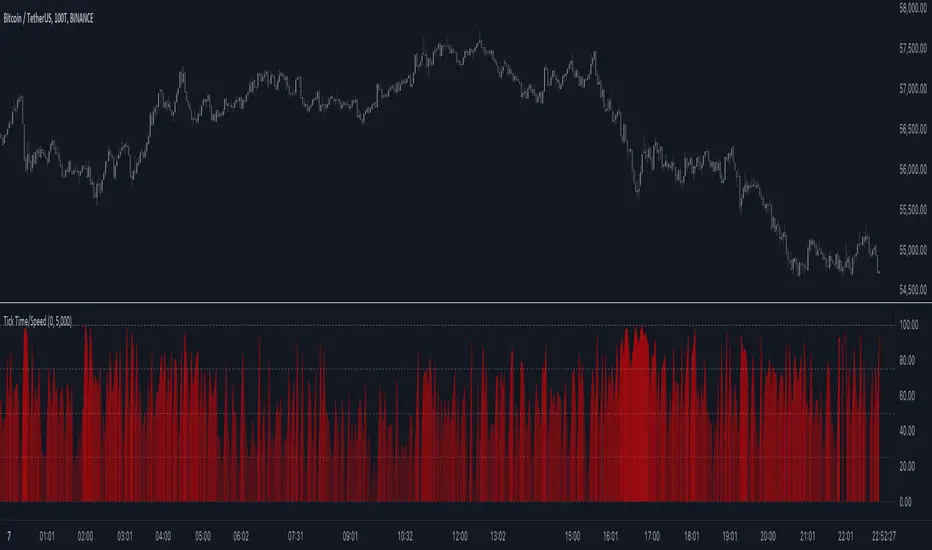
10T chart (ticks groups per 10)

100T chart (ticks groups per 100)
(zoom in to see the time scale, as can be seen in the above two examples, higher values represent more ticks in a shorter period of time)
The difference in time (speed) against previous tick(s) is added to an array and sorted. The measured speed is compared against every value in the array and then plotted.
A smaller difference in time against other ticks (more ticks in less time) is plotted higher, while a more prominent time difference is plotted at a lower level.
The amount of data (to compare with) can be set by "Calculated Bars".

The above example uses data from the last 5000, 100, and 77 bars.
🔶 SETTINGS
• Color & transparency setting
• Calculated Bars: sets the size of the array; in other words, sets the amount of available data for 'speed' comparison
🔶 NOTES
🔶 USAGE
1-minute chart
Unlike regular charts, where the time difference between two bars is relatively equal, the time difference between two tick bars can vary.
1T chart
10T chart (ticks groups per 10)
100T chart (ticks groups per 100)
(zoom in to see the time scale, as can be seen in the above two examples, higher values represent more ticks in a shorter period of time)
The difference in time (speed) against previous tick(s) is added to an array and sorted. The measured speed is compared against every value in the array and then plotted.
A smaller difference in time against other ticks (more ticks in less time) is plotted higher, while a more prominent time difference is plotted at a lower level.
The amount of data (to compare with) can be set by "Calculated Bars".
The above example uses data from the last 5000, 100, and 77 bars.
🔶 SETTINGS
• Color & transparency setting
• Calculated Bars: sets the size of the array; in other words, sets the amount of available data for 'speed' comparison
🔶 NOTES
- At this point of time, Tick Charts are only reserved for Professional-tier plans – Expert, Elite, or Ultimate plan.
- The indicator can only be used with Tick Data.
- Not all exchanges have tick data at the moment, this means not every ticker will have Tick Data.
오픈 소스 스크립트
트레이딩뷰의 진정한 정신에 따라, 이 스크립트의 작성자는 이를 오픈소스로 공개하여 트레이더들이 기능을 검토하고 검증할 수 있도록 했습니다. 작성자에게 찬사를 보냅니다! 이 코드는 무료로 사용할 수 있지만, 코드를 재게시하는 경우 하우스 룰이 적용된다는 점을 기억하세요.
Who are PineCoders?
tradingview.com/chart/SSP/yW5eOqtm-Who-are-PineCoders/
TG Pine Script® Q&A: t.me/PineCodersQA
- We cannot control our emotions,
but we can control our keyboard -
tradingview.com/chart/SSP/yW5eOqtm-Who-are-PineCoders/
TG Pine Script® Q&A: t.me/PineCodersQA
- We cannot control our emotions,
but we can control our keyboard -
면책사항
해당 정보와 게시물은 금융, 투자, 트레이딩 또는 기타 유형의 조언이나 권장 사항으로 간주되지 않으며, 트레이딩뷰에서 제공하거나 보증하는 것이 아닙니다. 자세한 내용은 이용 약관을 참조하세요.