OPEN-SOURCE SCRIPT
업데이트됨 Choose Symbol, candle and Trend mode
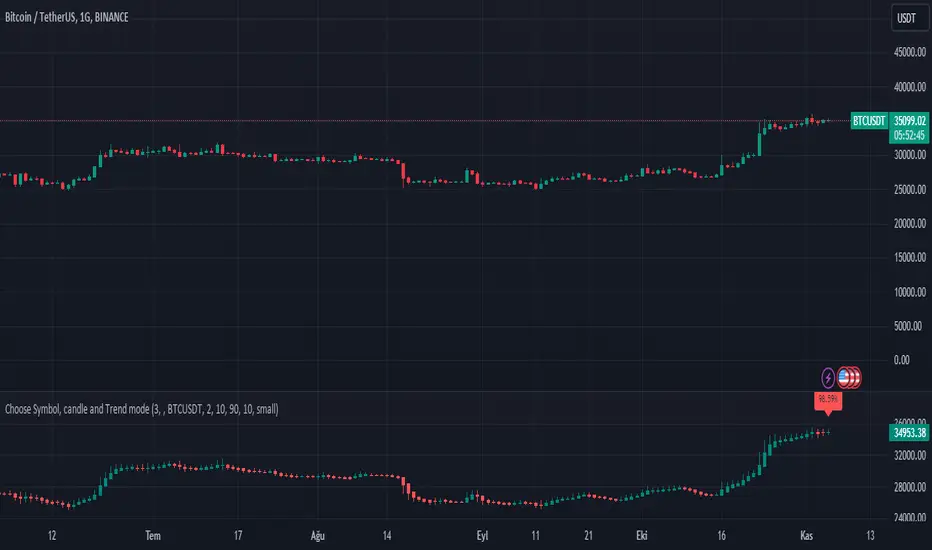
This Pine Script code is designed for technical analysis and visualization of price movements on the TradingView platform. It serves as a tool for traders and investors to:
Price Chart Analysis: The code plots the price chart of a selected symbol and utilizes Heikin-Ashi candlesticks to visualize price movements. This aids in better understanding price trends, support and resistance levels, retracements, and other price actions.
Trend Identification: The code also employs the Exponential Moving Average (EMA) to identify the price trend. EMA is commonly used to determine the strength and direction of a trend. Traders and investors can use this information to track trends and develop trading strategies.
Buy and Sell Signals: The code generates buy and sell signals based on EMA. These signals provide information on when to consider buying or selling a specific symbol. This is particularly useful for traders when making trading decisions.
Timeframe Customization: Users can adapt the code to different timeframes. This flexibility is valuable for those looking to develop strategies for both short-term and long-term trading.
Customization: The code allows users to customize various parameters, including the symbol, timeframe, Heikin-Ashi mode, and others. This enables it to be tailored to different assets and trading styles.
Please note that this code is provided for educational and informational purposes only. It does not constitute financial advice or recommendations for specific trading actions. Any trading decisions made using this code should be based on individual research, analysis, and a clear understanding of the associated risks.
릴리즈 노트
This Pine Script code is designed for technical analysis and visualization of price movements on the TradingView platform. It serves as a tool for traders and investors to:Price Chart Analysis: The code plots the price chart of a selected symbol and utilizes Heikin-Ashi candlesticks to visualize price movements. This aids in better understanding price trends, support and resistance levels, retracements, and other price actions.
Trend Identification: The code also employs the Exponential Moving Average (EMA) to identify the price trend. EMA is commonly used to determine the strength and direction of a trend. Traders and investors can use this information to track trends and develop trading strategies.
Buy and Sell Signals: The code generates buy and sell signals based on EMA. These signals provide percentage information on when to consider buying or selling a specific symbol. This is particularly useful for traders when making trading decisions.
Overbought and Oversold Levels: The code allows users to set overbought and oversold levels, helping to identify potential reversal points or areas of price exhaustion.
Timeframe Customization: Users can adapt the code to different timeframes. This flexibility is valuable for those looking to develop strategies for both short-term and long-term trading.
Customization: The code allows users to customize various parameters, including the symbol, timeframe, Heikin-Ashi mode, and others. This enables it to be tailored to different assets and trading styles.
Please note that this code is provided for educational and informational purposes only. It does not constitute financial advice or recommendations for specific trading actions. Any trading decisions made using this code should be based on individual research, analysis, and a clear understanding of the associated risks.
릴리즈 노트
This Pine Script code is designed for technical analysis and visualization of price movements on the TradingView platform. It serves as a tool for traders and investors to:Price Calculation: The code calculates the Exponential Moving Averages (EMA) of open, high, low, and close prices. These moving averages are used to create smoothed price values for the Heikin-Ashi chart.
Price Chart Analysis: The code plots the price chart of a selected symbol and utilizes Heikin-Ashi candlesticks to visualize price movements. This aids in better understanding price trends, support and resistance levels, retracements, and other price actions.
Trend Identification: The code also employs the Exponential Moving Average (EMA) to identify the price trend. EMA is commonly used to determine the strength and direction of a trend. Traders and investors can use this information to track trends and develop trading strategies.
Buy and Sell Signals: The code generates buy and sell signals based on EMA. These signals provide percentage information on when to consider buying or selling a specific symbol. This is particularly useful for traders when making trading decisions.
Overbought and Oversold Levels: The code allows users to set overbought and oversold levels, helping to identify potential reversal points or areas of price exhaustion.
Timeframe Customization: Users can adapt the code to different timeframes. This flexibility is valuable for those looking to develop strategies for both short-term and long-term trading.
Customization: The code allows users to customize various parameters, including the symbol, timeframe, Heikin-Ashi mode, and others. This enables it to be tailored to different assets and trading styles.
Please note that this code is provided for educational and informational purposes only. It does not constitute financial advice or recommendations for specific trading actions. Any trading decisions made using this code should be based on individual research, analysis, and a clear understanding of the associated risks.
오픈 소스 스크립트
트레이딩뷰의 진정한 정신에 따라, 이 스크립트의 작성자는 이를 오픈소스로 공개하여 트레이더들이 기능을 검토하고 검증할 수 있도록 했습니다. 작성자에게 찬사를 보냅니다! 이 코드는 무료로 사용할 수 있지만, 코드를 재게시하는 경우 하우스 룰이 적용된다는 점을 기억하세요.
면책사항
해당 정보와 게시물은 금융, 투자, 트레이딩 또는 기타 유형의 조언이나 권장 사항으로 간주되지 않으며, 트레이딩뷰에서 제공하거나 보증하는 것이 아닙니다. 자세한 내용은 이용 약관을 참조하세요.
오픈 소스 스크립트
트레이딩뷰의 진정한 정신에 따라, 이 스크립트의 작성자는 이를 오픈소스로 공개하여 트레이더들이 기능을 검토하고 검증할 수 있도록 했습니다. 작성자에게 찬사를 보냅니다! 이 코드는 무료로 사용할 수 있지만, 코드를 재게시하는 경우 하우스 룰이 적용된다는 점을 기억하세요.
면책사항
해당 정보와 게시물은 금융, 투자, 트레이딩 또는 기타 유형의 조언이나 권장 사항으로 간주되지 않으며, 트레이딩뷰에서 제공하거나 보증하는 것이 아닙니다. 자세한 내용은 이용 약관을 참조하세요.