OPEN-SOURCE SCRIPT
Chervolinos-Wave-PM-Forecast
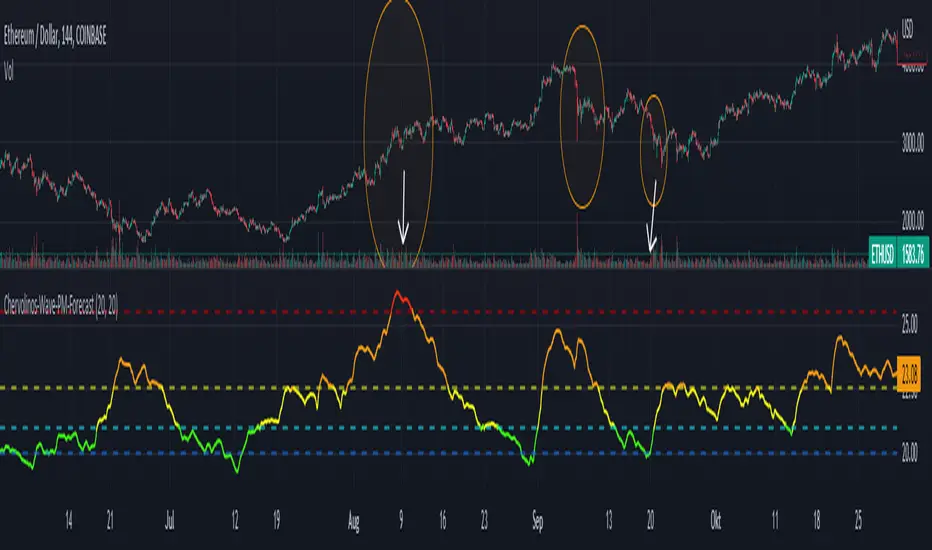
The Wave PM (Whistler Active Volatility Energy – Price Mass) indicator is an oscillator described in Mark Whistler's book, Volatility Illuminated.
The Wave PM is specifically designed to help read volatility cycles. When we visualize volatility cycles as a chart, we can get a clear view of the market volatility phases in multiple time frames. This indicator forms an arithmetic mean over 30 observed periods. Traders can thus get a better insight into "potential" volatility from up to pent-up energy, the different zones give strong help to predict future price developments.
Possible interpretation patterns:
You are at the end of a long uptrend and you want to know if the price is going to go down, if the indicator shows red and the value is above 25, it is likely to do so.
You're in a downtrend and there's a bit of a recovery phase, so you might be wondering if it's going to continue when the indicator shows green. It would go further with yellow, but with green it can be assumed that it is going down rapidly.
Special thanks to sourcey who programmed the 3D Wave-PM.
This variant of sourcey looks very nice, but was too confusing for me. In order to get a strong overview, forming an arithmetic mean is very useful.
I hope you and the Mods like my version
Best regards, Chervolino
오픈 소스 스크립트
트레이딩뷰의 진정한 정신에 따라, 이 스크립트의 작성자는 이를 오픈소스로 공개하여 트레이더들이 기능을 검토하고 검증할 수 있도록 했습니다. 작성자에게 찬사를 보냅니다! 이 코드는 무료로 사용할 수 있지만, 코드를 재게시하는 경우 하우스 룰이 적용된다는 점을 기억하세요.
면책사항
해당 정보와 게시물은 금융, 투자, 트레이딩 또는 기타 유형의 조언이나 권장 사항으로 간주되지 않으며, 트레이딩뷰에서 제공하거나 보증하는 것이 아닙니다. 자세한 내용은 이용 약관을 참조하세요.
오픈 소스 스크립트
트레이딩뷰의 진정한 정신에 따라, 이 스크립트의 작성자는 이를 오픈소스로 공개하여 트레이더들이 기능을 검토하고 검증할 수 있도록 했습니다. 작성자에게 찬사를 보냅니다! 이 코드는 무료로 사용할 수 있지만, 코드를 재게시하는 경우 하우스 룰이 적용된다는 점을 기억하세요.
면책사항
해당 정보와 게시물은 금융, 투자, 트레이딩 또는 기타 유형의 조언이나 권장 사항으로 간주되지 않으며, 트레이딩뷰에서 제공하거나 보증하는 것이 아닙니다. 자세한 내용은 이용 약관을 참조하세요.