OPEN-SOURCE SCRIPT
업데이트됨 Multi ZigZag EW - Impulse

Similar to the previous script on Elliot Wave Impulse:

But, here we are trying to use multiple zigzags instead of just one.
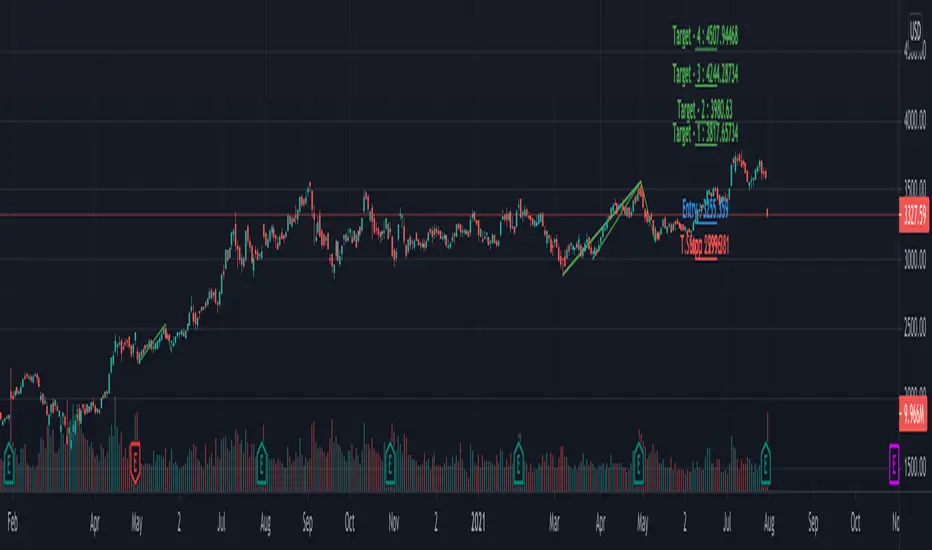
You can select upto 4 different Zigzags and set different length, line color, line width and style for each. Parameters ShowZigZag[1-4], ZigZag[1-4]Length, ZigZag[1-4]Color, ZigZag[1-4]Width, ZigZag[1-4]Style can be used for adjusting these.
ErrorPercent lets you set error threshold calculation of ratios for pattern identification
EntryPercent is used for marking Entry and T.Stop (Tight Stoploss) based on the length of Wave 2.
Target of the script is same as before. We are trying to identify Wave 1 and 2 of Elliot Impulese Wave and then project Wave 3. Chances of price following the pattern are there. Hence, we set Stoploss based on levels which fails the pattern.
Ratios are taken from below link: elliottwave-forecast.com/elliott-wave-theory/ - Section 3.1 Impulse
Since we use multiple zigzags, labels can be quite messy at times. In such scenarios, just disable one of the zigzag length causing label overlaps.

But, here we are trying to use multiple zigzags instead of just one.
You can select upto 4 different Zigzags and set different length, line color, line width and style for each. Parameters ShowZigZag[1-4], ZigZag[1-4]Length, ZigZag[1-4]Color, ZigZag[1-4]Width, ZigZag[1-4]Style can be used for adjusting these.
ErrorPercent lets you set error threshold calculation of ratios for pattern identification
EntryPercent is used for marking Entry and T.Stop (Tight Stoploss) based on the length of Wave 2.
Target of the script is same as before. We are trying to identify Wave 1 and 2 of Elliot Impulese Wave and then project Wave 3. Chances of price following the pattern are there. Hence, we set Stoploss based on levels which fails the pattern.
Ratios are taken from below link: elliottwave-forecast.com/elliott-wave-theory/ - Section 3.1 Impulse
- Wave 2 is 50%, 61.8%, 76.4%, or 85.4% of wave 1 - used for identifying the pattern.
- Wave 3 is 161.8%, 200%, 261.8%, or 323.6% of wave 1-2 - used for setting the targets
Since we use multiple zigzags, labels can be quite messy at times. In such scenarios, just disable one of the zigzag length causing label overlaps.
릴리즈 노트
Fix zigzag calculation error릴리즈 노트
Convert to pine 5오픈 소스 스크립트
트레이딩뷰의 진정한 정신에 따라, 이 스크립트의 작성자는 이를 오픈소스로 공개하여 트레이더들이 기능을 검토하고 검증할 수 있도록 했습니다. 작성자에게 찬사를 보냅니다! 이 코드는 무료로 사용할 수 있지만, 코드를 재게시하는 경우 하우스 룰이 적용된다는 점을 기억하세요.
Trial - trendoscope.io/trial
Subscribe - trendoscope.io/pricing
Blog - docs.trendoscope.io
Subscribe - trendoscope.io/pricing
Blog - docs.trendoscope.io
면책사항
해당 정보와 게시물은 금융, 투자, 트레이딩 또는 기타 유형의 조언이나 권장 사항으로 간주되지 않으며, 트레이딩뷰에서 제공하거나 보증하는 것이 아닙니다. 자세한 내용은 이용 약관을 참조하세요.
오픈 소스 스크립트
트레이딩뷰의 진정한 정신에 따라, 이 스크립트의 작성자는 이를 오픈소스로 공개하여 트레이더들이 기능을 검토하고 검증할 수 있도록 했습니다. 작성자에게 찬사를 보냅니다! 이 코드는 무료로 사용할 수 있지만, 코드를 재게시하는 경우 하우스 룰이 적용된다는 점을 기억하세요.
Trial - trendoscope.io/trial
Subscribe - trendoscope.io/pricing
Blog - docs.trendoscope.io
Subscribe - trendoscope.io/pricing
Blog - docs.trendoscope.io
면책사항
해당 정보와 게시물은 금융, 투자, 트레이딩 또는 기타 유형의 조언이나 권장 사항으로 간주되지 않으며, 트레이딩뷰에서 제공하거나 보증하는 것이 아닙니다. 자세한 내용은 이용 약관을 참조하세요.