OPEN-SOURCE SCRIPT
Average Directional Index + MA (with Fill trend color)
Description
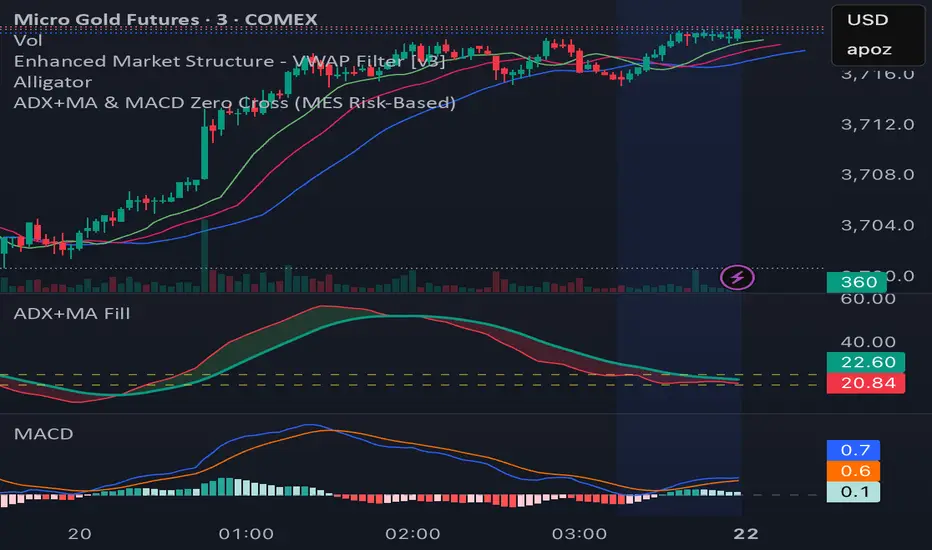
This indicator combines the Average Directional Index (ADX) with a configurable moving average (SMA, EMA, RMA, or WMA) and visual fill. It helps traders assess the strength of a trend by highlighting when ADX is above or below its moving average.
When ADX is rising above the MA, it suggests strengthening momentum; when falling below, it indicates weakening momentum. The dynamic green/red fill makes these transitions easy to spot.
Horizontal threshold levels at 20 and 25 are included as key references:
Below 20 → often signals ranging or sideways/consolidation markets.
Crossing above 20 or 25 → may suggest the beginning of a breakout or trend, useful for trend-following strategies.
How to use
Filter out sideways/consolidation phases and focus on breakout or trend-following opportunities when price action coincides with ADX crossing above the 20/25 thresholds.
Customization
ADX length & smoothing.
Moving average type and length.
Adjustable fill transparency.
Optional threshold lines at 20 and 25.
오픈 소스 스크립트
진정한 트레이딩뷰 정신에 따라 이 스크립트 작성자는 트레이더가 기능을 검토하고 검증할 수 있도록 오픈소스로 공개했습니다. 작성자에게 찬사를 보냅니다! 무료로 사용할 수 있지만 코드를 다시 게시할 경우 하우스 룰이 적용된다는 점을 기억하세요.
면책사항
이 정보와 게시물은 TradingView에서 제공하거나 보증하는 금융, 투자, 거래 또는 기타 유형의 조언이나 권고 사항을 의미하거나 구성하지 않습니다. 자세한 내용은 이용 약관을 참고하세요.
오픈 소스 스크립트
진정한 트레이딩뷰 정신에 따라 이 스크립트 작성자는 트레이더가 기능을 검토하고 검증할 수 있도록 오픈소스로 공개했습니다. 작성자에게 찬사를 보냅니다! 무료로 사용할 수 있지만 코드를 다시 게시할 경우 하우스 룰이 적용된다는 점을 기억하세요.
면책사항
이 정보와 게시물은 TradingView에서 제공하거나 보증하는 금융, 투자, 거래 또는 기타 유형의 조언이나 권고 사항을 의미하거나 구성하지 않습니다. 자세한 내용은 이용 약관을 참고하세요.