OPEN-SOURCE SCRIPT
Multi-Timeframe EMAs
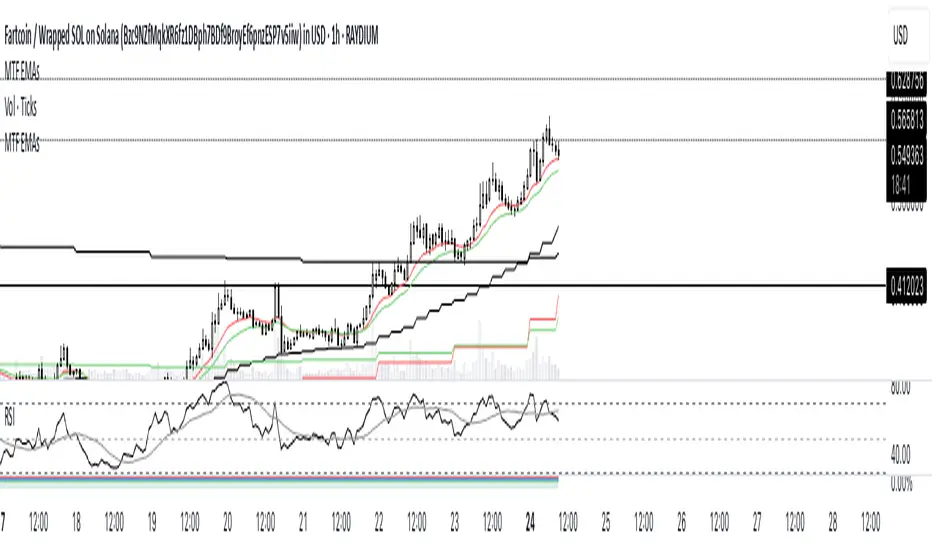
This TradingView indicator provides a comprehensive overview of price momentum by overlaying multiple Exponential Moving Averages (EMAs) from different timeframes onto a single chart. By combining 1-hour, 4-hour, and daily EMAs, you can observe short-term trends while simultaneously monitoring medium-term and long-term market dynamics. The 1-hour EMA 13 and EMA 21 help capture rapid price changes, which is useful for scalpers or intraday traders looking to identify sudden momentum shifts. Meanwhile, the 4-hour EMA 21 offers a more stable, intermediate perspective, filtering out some of the noise found in shorter intervals. Finally, the daily EMAs (13, 25, and 50) highlight prevailing market sentiment over a longer period, enabling traders to assess higher-level trends and gauge whether short-term signals align with overarching tendencies. By plotting all these EMAs together, it becomes easier to detect confluences or divergences across different time horizons, making it simpler to refine entries and exits based on multi-timeframe confirmation. This script is especially helpful for swing traders and position traders who wish to ensure that smaller timeframe strategies do not conflict with long-term market direction.
오픈 소스 스크립트
트레이딩뷰의 진정한 정신에 따라, 이 스크립트의 작성자는 이를 오픈소스로 공개하여 트레이더들이 기능을 검토하고 검증할 수 있도록 했습니다. 작성자에게 찬사를 보냅니다! 이 코드는 무료로 사용할 수 있지만, 코드를 재게시하는 경우 하우스 룰이 적용된다는 점을 기억하세요.
면책사항
해당 정보와 게시물은 금융, 투자, 트레이딩 또는 기타 유형의 조언이나 권장 사항으로 간주되지 않으며, 트레이딩뷰에서 제공하거나 보증하는 것이 아닙니다. 자세한 내용은 이용 약관을 참조하세요.
오픈 소스 스크립트
트레이딩뷰의 진정한 정신에 따라, 이 스크립트의 작성자는 이를 오픈소스로 공개하여 트레이더들이 기능을 검토하고 검증할 수 있도록 했습니다. 작성자에게 찬사를 보냅니다! 이 코드는 무료로 사용할 수 있지만, 코드를 재게시하는 경우 하우스 룰이 적용된다는 점을 기억하세요.
면책사항
해당 정보와 게시물은 금융, 투자, 트레이딩 또는 기타 유형의 조언이나 권장 사항으로 간주되지 않으며, 트레이딩뷰에서 제공하거나 보증하는 것이 아닙니다. 자세한 내용은 이용 약관을 참조하세요.