OPEN-SOURCE SCRIPT
업데이트됨 Relative Performance
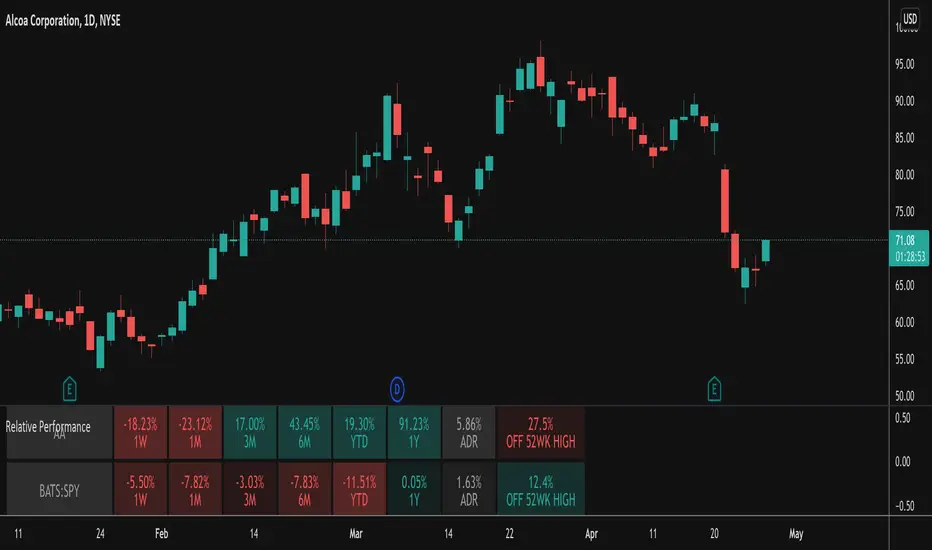
This indicator takes the Performance Table from BeeHolder and converts it to a Relative Performance table so you can compare the current chart vs. an Index (or whatever other ticker you want) to see the relative performance of one vs. the other. I also added a cell for ADR, which is also the same value as "Monthly Volatility" in the stock screener. This can be useful when screening stocks based on performance and volatility.
릴리즈 노트
Conversion to Pine v5Added a box to the table that looks at the distance from the 52 week high. The idea behind this is that the strongest stocks will be close to their highs and that's what you should focus on. I've coded it so that if a stock is within 25% of its 52 week high the color will be green indicating a good candidate.
릴리즈 노트
Changed the calculation for distance from the 52 week high to be the drawdown off the high instead of the percentage required to get back to the high as I think this is what people usually refer to when talking about this metric.오픈 소스 스크립트
트레이딩뷰의 진정한 정신에 따라, 이 스크립트의 작성자는 이를 오픈소스로 공개하여 트레이더들이 기능을 검토하고 검증할 수 있도록 했습니다. 작성자에게 찬사를 보냅니다! 이 코드는 무료로 사용할 수 있지만, 코드를 재게시하는 경우 하우스 룰이 적용된다는 점을 기억하세요.
면책사항
해당 정보와 게시물은 금융, 투자, 트레이딩 또는 기타 유형의 조언이나 권장 사항으로 간주되지 않으며, 트레이딩뷰에서 제공하거나 보증하는 것이 아닙니다. 자세한 내용은 이용 약관을 참조하세요.
오픈 소스 스크립트
트레이딩뷰의 진정한 정신에 따라, 이 스크립트의 작성자는 이를 오픈소스로 공개하여 트레이더들이 기능을 검토하고 검증할 수 있도록 했습니다. 작성자에게 찬사를 보냅니다! 이 코드는 무료로 사용할 수 있지만, 코드를 재게시하는 경우 하우스 룰이 적용된다는 점을 기억하세요.
면책사항
해당 정보와 게시물은 금융, 투자, 트레이딩 또는 기타 유형의 조언이나 권장 사항으로 간주되지 않으며, 트레이딩뷰에서 제공하거나 보증하는 것이 아닙니다. 자세한 내용은 이용 약관을 참조하세요.