OPEN-SOURCE SCRIPT
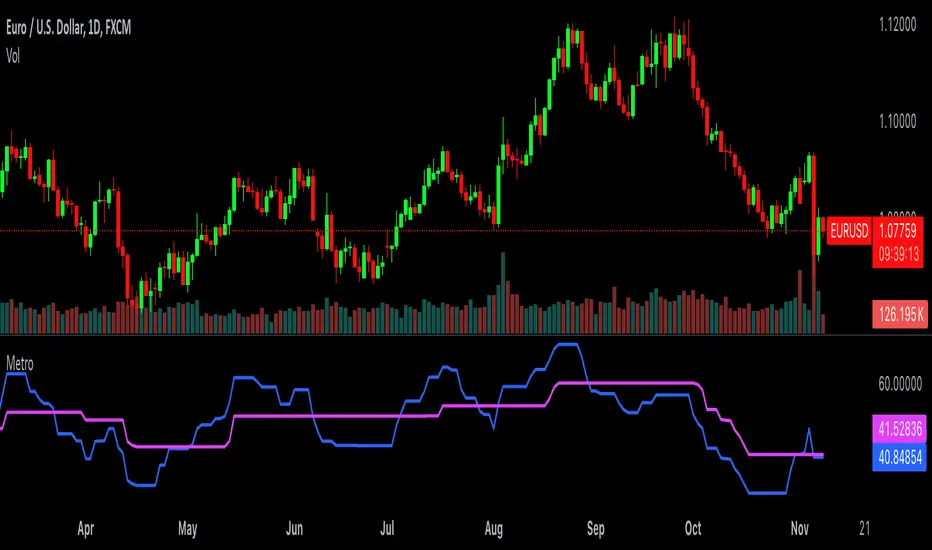
Simplified Metro

This is a derivative of J. Welles Wilder's RSI (Relative Strength Index) from 1978. This version uses a fast and slow offset of the RSI to create signals. The RSI itself has been removed from this version for visual simplicity, but its setting still has an impact on the fast and slow stepped lines.
The "RSI Period" sets the number of bars used to calculate the RSI. A higher value results in a smoother RSI, while a lower value makes it more reactive to price changes.
The "Fast Step Size" defines the step size for the fast trend line. A larger value makes the fast step line less sensitive to RSI changes, creating a smoother line.
The "Slow Step Size" defines the step size for the slow trend line. A larger value makes the slow step line less sensitive to RSI changes, resulting in a smoother line compared to the fast step.
When the faster blue line crosses and closes above the slower fuchsia line we have a signal to go long, and vice versa we take a short position.
This indicator should not be traded on its own, but could be a valuable addition to a system used for identifying trends.
오픈 소스 스크립트
트레이딩뷰의 진정한 정신에 따라, 이 스크립트의 작성자는 이를 오픈소스로 공개하여 트레이더들이 기능을 검토하고 검증할 수 있도록 했습니다. 작성자에게 찬사를 보냅니다! 이 코드는 무료로 사용할 수 있지만, 코드를 재게시하는 경우 하우스 룰이 적용된다는 점을 기억하세요.
면책사항
해당 정보와 게시물은 금융, 투자, 트레이딩 또는 기타 유형의 조언이나 권장 사항으로 간주되지 않으며, 트레이딩뷰에서 제공하거나 보증하는 것이 아닙니다. 자세한 내용은 이용 약관을 참조하세요.
오픈 소스 스크립트
트레이딩뷰의 진정한 정신에 따라, 이 스크립트의 작성자는 이를 오픈소스로 공개하여 트레이더들이 기능을 검토하고 검증할 수 있도록 했습니다. 작성자에게 찬사를 보냅니다! 이 코드는 무료로 사용할 수 있지만, 코드를 재게시하는 경우 하우스 룰이 적용된다는 점을 기억하세요.
면책사항
해당 정보와 게시물은 금융, 투자, 트레이딩 또는 기타 유형의 조언이나 권장 사항으로 간주되지 않으며, 트레이딩뷰에서 제공하거나 보증하는 것이 아닙니다. 자세한 내용은 이용 약관을 참조하세요.