INVITE-ONLY SCRIPT
업데이트됨 Critical Support & Resistance Level (supply & demand zone)
Support & Resistance Level and Supply & Demand Zone are very common and popular jargon in technical analysis.
What is the difference between Support & Resistance Level and Supply & Demand Zone?
In my opinion, Support & Resistance Level is the value of price that tested couple times and hard to break. The zone is formed by two adjacent levels where price may oscillate between those two levels.
Imagine the levels as horizontal lines, and the zones are areas between two horizontal lines.
Why are they important?
In a nutshell, they indicate where the price direction may reverse so you can act accordingly.
There are a couple methods to draw the Support & Resistance Level and Supply & Demand Zone, In most case, people will use swing high or low, or pivot points as the level. But there are too many of them, and not all pivot points will become Support & Resistance Level.
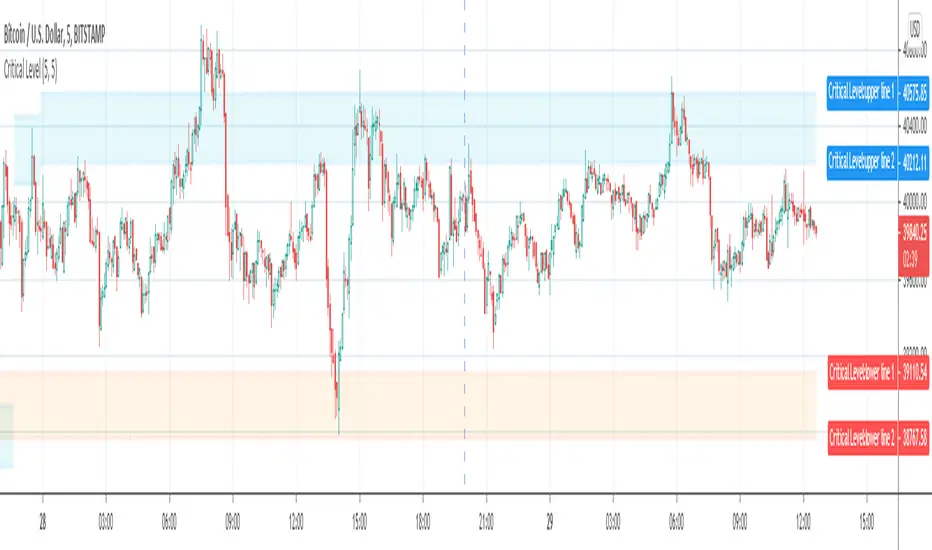
Some of the support or resistance level is hard to break, but after the price break through that level, resistance will become support and vice versa, I define it as Critical Level.
If you draw a critical support or resistance level from the current bar and move backward to where it started, you will notice that some levels are formed by the pivot points from hundreds of bars ago. It's impossible to discover the Critical Levels if you don't have enough bars loaded on chart.
The purpose of this indicator is to plot critical support and resistance level automatically on chart.
It will work on all market, Stock, Forex and Futures. It also works on all timeframes.
Inputs:
The Strength inputs control the intensity of Support & Resistance Level.
The Alert input is the switch of alert function.
By enable Enhanced mode, the indicator will be more critical.
Check Showline input to plot level lines on chart, otherwise, it will plot zones only.
What is the difference between Support & Resistance Level and Supply & Demand Zone?
In my opinion, Support & Resistance Level is the value of price that tested couple times and hard to break. The zone is formed by two adjacent levels where price may oscillate between those two levels.
Imagine the levels as horizontal lines, and the zones are areas between two horizontal lines.
Why are they important?
In a nutshell, they indicate where the price direction may reverse so you can act accordingly.
There are a couple methods to draw the Support & Resistance Level and Supply & Demand Zone, In most case, people will use swing high or low, or pivot points as the level. But there are too many of them, and not all pivot points will become Support & Resistance Level.
Some of the support or resistance level is hard to break, but after the price break through that level, resistance will become support and vice versa, I define it as Critical Level.
If you draw a critical support or resistance level from the current bar and move backward to where it started, you will notice that some levels are formed by the pivot points from hundreds of bars ago. It's impossible to discover the Critical Levels if you don't have enough bars loaded on chart.
The purpose of this indicator is to plot critical support and resistance level automatically on chart.
It will work on all market, Stock, Forex and Futures. It also works on all timeframes.
Inputs:
The Strength inputs control the intensity of Support & Resistance Level.
The Alert input is the switch of alert function.
By enable Enhanced mode, the indicator will be more critical.
Check Showline input to plot level lines on chart, otherwise, it will plot zones only.
릴리즈 노트
Added 4 new alert types릴리즈 노트
Minor update.릴리즈 노트
Update to version 4 with a new algorithm to automatically check uptrend and downtrend Support & Resistance Levels.릴리즈 노트
Update to version=5초대 전용 스크립트
이 스크립트는 작성자가 승인한 사용자만 접근할 수 있습니다. 사용하려면 요청 후 승인을 받아야 하며, 일반적으로 결제 후에 허가가 부여됩니다. 자세한 내용은 아래 작성자의 안내를 따르거나 Patternsmart에게 직접 문의하세요.
트레이딩뷰는 스크립트의 작동 방식을 충분히 이해하고 작성자를 완전히 신뢰하지 않는 이상, 해당 스크립트에 비용을 지불하거나 사용하는 것을 권장하지 않습니다. 커뮤니티 스크립트에서 무료 오픈소스 대안을 찾아보실 수도 있습니다.
작성자 지시 사항
Use the link below to obtain access to this indicator, https://www.patternsmart.com/cart/index.php?route=product/product&product_id=380&search=critical
면책사항
해당 정보와 게시물은 금융, 투자, 트레이딩 또는 기타 유형의 조언이나 권장 사항으로 간주되지 않으며, 트레이딩뷰에서 제공하거나 보증하는 것이 아닙니다. 자세한 내용은 이용 약관을 참조하세요.
초대 전용 스크립트
이 스크립트는 작성자가 승인한 사용자만 접근할 수 있습니다. 사용하려면 요청 후 승인을 받아야 하며, 일반적으로 결제 후에 허가가 부여됩니다. 자세한 내용은 아래 작성자의 안내를 따르거나 Patternsmart에게 직접 문의하세요.
트레이딩뷰는 스크립트의 작동 방식을 충분히 이해하고 작성자를 완전히 신뢰하지 않는 이상, 해당 스크립트에 비용을 지불하거나 사용하는 것을 권장하지 않습니다. 커뮤니티 스크립트에서 무료 오픈소스 대안을 찾아보실 수도 있습니다.
작성자 지시 사항
Use the link below to obtain access to this indicator, https://www.patternsmart.com/cart/index.php?route=product/product&product_id=380&search=critical
면책사항
해당 정보와 게시물은 금융, 투자, 트레이딩 또는 기타 유형의 조언이나 권장 사항으로 간주되지 않으며, 트레이딩뷰에서 제공하거나 보증하는 것이 아닙니다. 자세한 내용은 이용 약관을 참조하세요.