OPEN-SOURCE SCRIPT
Asian Range Indicator

Indicator Name:
Asian Range Indicator
Description:
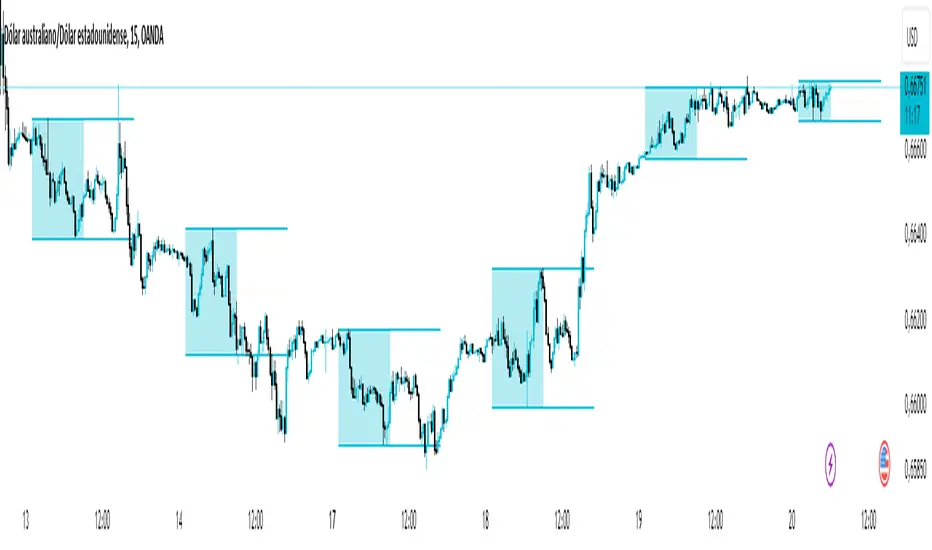
This TradingView indicator is designed to accurately detect the price range during the Asian session, based on our trading strategy. This range is crucial for planning trades in the European and American sessions. Using advanced algorithms, the indicator automatically identifies and plots the highs and lows within the Asian session period, highlighting them on the chart with shaded areas for clear visualization. This helps traders anticipate breakouts and set more precise entry and exit levels.
How to Use the Indicator:
Add the indicator to your TradingView chart.
Observe the shaded areas representing the Asian range.
Use these levels to plan your trades during the European and American sessions.
Combine with other technical indicators to confirm your trading decisions.
Chart:
The chart published with this script is clean and easy to understand, clearly showing the Asian range highlighted with shaded areas. No other scripts are included, ensuring the indicator's output is easily identifiable. The shaded areas contribute to the visual understanding of the Asian range, helping traders effectively use the script.
오픈 소스 스크립트
트레이딩뷰의 진정한 정신에 따라, 이 스크립트의 작성자는 이를 오픈소스로 공개하여 트레이더들이 기능을 검토하고 검증할 수 있도록 했습니다. 작성자에게 찬사를 보냅니다! 이 코드는 무료로 사용할 수 있지만, 코드를 재게시하는 경우 하우스 룰이 적용된다는 점을 기억하세요.
면책사항
해당 정보와 게시물은 금융, 투자, 트레이딩 또는 기타 유형의 조언이나 권장 사항으로 간주되지 않으며, 트레이딩뷰에서 제공하거나 보증하는 것이 아닙니다. 자세한 내용은 이용 약관을 참조하세요.
오픈 소스 스크립트
트레이딩뷰의 진정한 정신에 따라, 이 스크립트의 작성자는 이를 오픈소스로 공개하여 트레이더들이 기능을 검토하고 검증할 수 있도록 했습니다. 작성자에게 찬사를 보냅니다! 이 코드는 무료로 사용할 수 있지만, 코드를 재게시하는 경우 하우스 룰이 적용된다는 점을 기억하세요.
면책사항
해당 정보와 게시물은 금융, 투자, 트레이딩 또는 기타 유형의 조언이나 권장 사항으로 간주되지 않으며, 트레이딩뷰에서 제공하거나 보증하는 것이 아닙니다. 자세한 내용은 이용 약관을 참조하세요.