OPEN-SOURCE SCRIPT
업데이트됨 Squeeze Momentum Signal Overlay [GN]
Companion script for Squeeze Momentum Indicator that plots the signal on chart.
릴리즈 노트
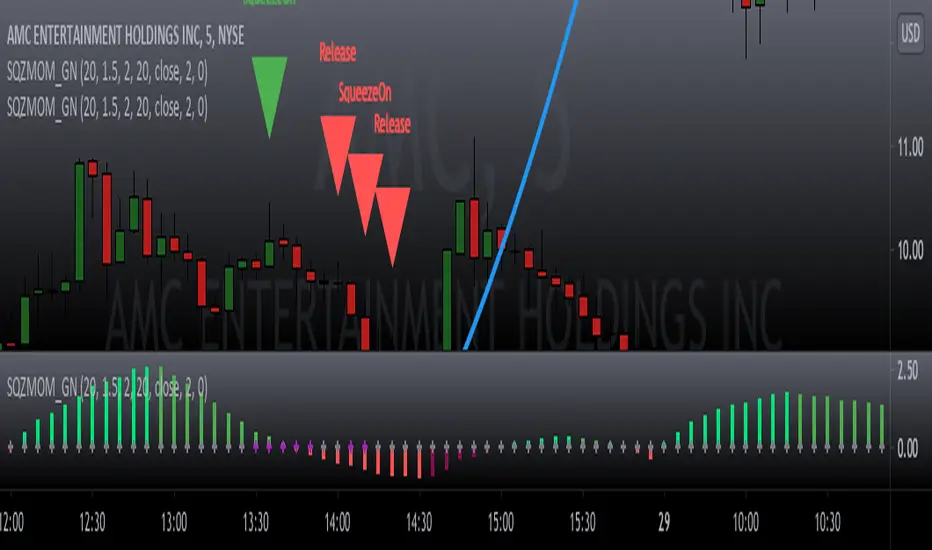
Squeeze Momentum Indicator shows when Bollinger Bands squeeze into the Keltner Channel. When this condition is met, price consolidation is typically followed by a move up or down. The histogram in the indicator helps predict direction of the price action breakout. If the histogram is flipping from red to green, the signal is bullish. If the histogram is flipping from green to red, the signal is bearish.This is a companion script that overlays the squeeze signals onto a chart.
릴리즈 노트
This script includes the direction of momentum using Red-Green triangles. A bullish signal occurs when the SqueezeOn triangle is Red and the Release triangle is Green; a bearish signal occurs when the SqueezOn triangle is Green and the Release triangle is red. 오픈 소스 스크립트
트레이딩뷰의 진정한 정신에 따라, 이 스크립트의 작성자는 이를 오픈소스로 공개하여 트레이더들이 기능을 검토하고 검증할 수 있도록 했습니다. 작성자에게 찬사를 보냅니다! 이 코드는 무료로 사용할 수 있지만, 코드를 재게시하는 경우 하우스 룰이 적용된다는 점을 기억하세요.
면책사항
해당 정보와 게시물은 금융, 투자, 트레이딩 또는 기타 유형의 조언이나 권장 사항으로 간주되지 않으며, 트레이딩뷰에서 제공하거나 보증하는 것이 아닙니다. 자세한 내용은 이용 약관을 참조하세요.
오픈 소스 스크립트
트레이딩뷰의 진정한 정신에 따라, 이 스크립트의 작성자는 이를 오픈소스로 공개하여 트레이더들이 기능을 검토하고 검증할 수 있도록 했습니다. 작성자에게 찬사를 보냅니다! 이 코드는 무료로 사용할 수 있지만, 코드를 재게시하는 경우 하우스 룰이 적용된다는 점을 기억하세요.
면책사항
해당 정보와 게시물은 금융, 투자, 트레이딩 또는 기타 유형의 조언이나 권장 사항으로 간주되지 않으며, 트레이딩뷰에서 제공하거나 보증하는 것이 아닙니다. 자세한 내용은 이용 약관을 참조하세요.