OPEN-SOURCE SCRIPT
Financial-Conditions Brake Index (FCBI) — US10Y brake on USIRYY
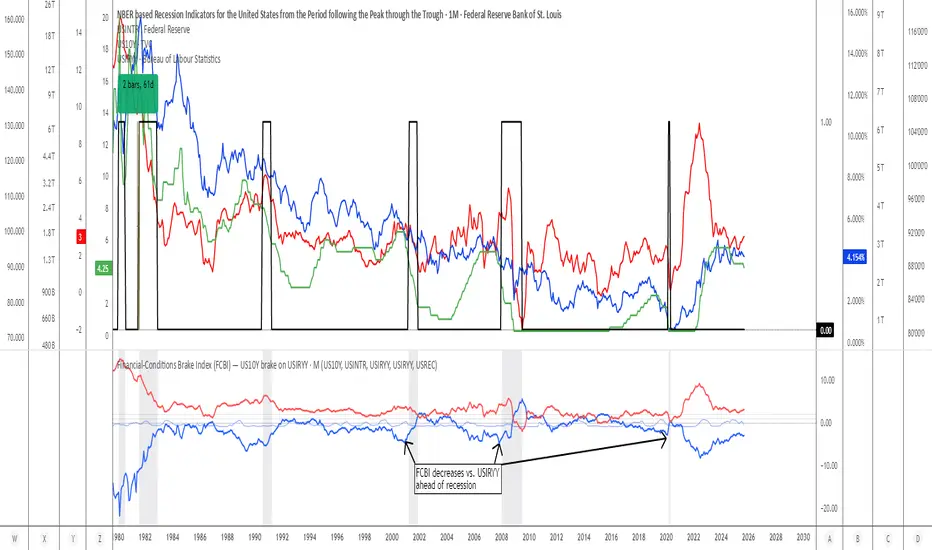
Financial-Conditions Brake Index (FCBI) – US10Y Brake on USIRYY
Concept
The Financial-Conditions Brake Index (FCBI) measures how U.S. long-term yields (US10Y) interact with the Federal Funds Rate (USINTR) and inflation (CPI YoY) to shape real-rate conditions (USIRYY).
It visualizes whether the bond market is tightening or loosening overall financial conditions relative to the Federal Reserve’s policy stance.
Formula
FCBI = (US10Y) − (USINTR) − (CPI YoY)
How It Works
The FCBI expresses the difference between the long-term yield curve and short-term policy rates, adjusted for inflation. It shows whether the long end of the curve is amplifying or counteracting the Fed’s stance.
FCBI > +2 → Strong brake → Long yields remain elevated despite easing → tight conditions → recession delayed.
FCBI +1 to +2 → Mild brake → Financial transmission slower; lag ≈ 12–18 months.
FCBI 0 to +1 → Neutral → Typical early post-cut environment.
FCBI < 0 → Accelerator → Long yields and inflation expectations falling → liquidity flows freely → recession often follows within 6–14 months.
How to Read the Chart
Blue line (FCBI) shows the strength of the financial brake.
Red line (USIRYY) represents the real yield baseline.
Recession shading (gray) marks NBER recessions for comparison.
FCBI < USIRYY → Brake engaged → financial conditions tighter than real-rate baseline.
FCBI > USIRYY → Brake released → long end easing faster than policy → liquidity surge → late-cycle setup.
Historically, U.S. recessions begin on average about 14 months after the first Fed rate cut, and a decline of the FCBI below zero often precedes that window.
Practical Use
Use the FCBI to identify when policy transmission is blocked (brake engaged) or flowing (brake released).
Cross-check with yield-curve inversions, Fed policy shifts, and inflation expectations to estimate macro timing windows.
Current Example (Oct 2025)
FCBI ≈ −3.1, USIRYY ≈ +3.0 → Brake still engaged.
Once FCBI rises above USIRYY and crosses positive, it signals the “brake released” phase — historically the final liquidity surge before a U.S. recession.
Summary
FCBI shows how tight the brake is.
USIRYY shows how fast the car is moving.
When FCBI rises above USIRYY, the brake is released — liquidity accelerates and the historical recession countdown begins.
오픈 소스 스크립트
트레이딩뷰의 진정한 정신에 따라, 이 스크립트의 작성자는 이를 오픈소스로 공개하여 트레이더들이 기능을 검토하고 검증할 수 있도록 했습니다. 작성자에게 찬사를 보냅니다! 이 코드는 무료로 사용할 수 있지만, 코드를 재게시하는 경우 하우스 룰이 적용된다는 점을 기억하세요.
면책사항
해당 정보와 게시물은 금융, 투자, 트레이딩 또는 기타 유형의 조언이나 권장 사항으로 간주되지 않으며, 트레이딩뷰에서 제공하거나 보증하는 것이 아닙니다. 자세한 내용은 이용 약관을 참조하세요.
오픈 소스 스크립트
트레이딩뷰의 진정한 정신에 따라, 이 스크립트의 작성자는 이를 오픈소스로 공개하여 트레이더들이 기능을 검토하고 검증할 수 있도록 했습니다. 작성자에게 찬사를 보냅니다! 이 코드는 무료로 사용할 수 있지만, 코드를 재게시하는 경우 하우스 룰이 적용된다는 점을 기억하세요.
면책사항
해당 정보와 게시물은 금융, 투자, 트레이딩 또는 기타 유형의 조언이나 권장 사항으로 간주되지 않으며, 트레이딩뷰에서 제공하거나 보증하는 것이 아닙니다. 자세한 내용은 이용 약관을 참조하세요.