PROTECTED SOURCE SCRIPT
업데이트됨 200 EMA RoC Vs Index
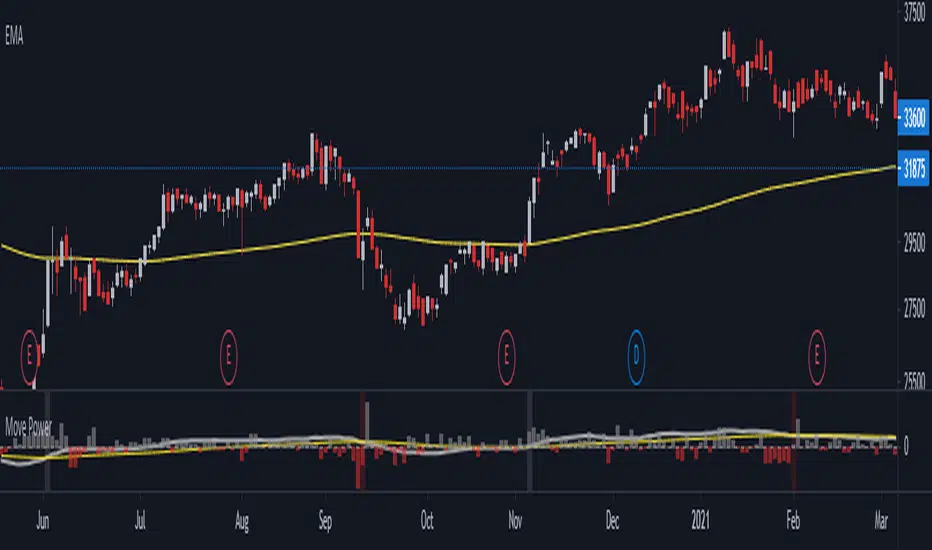
This indicator calculates 200 EMA rate of Change, between today's value vs yesterday's value
I found it useful and easier to track the trend.
I added 50 SMA as additional help top calculate averages between data. if the 50 SMA crosses over it will show gray background, and red if it crosses down.
The Histogram represent Index data.
Best use for Stock Market
I found it useful and easier to track the trend.
I added 50 SMA as additional help top calculate averages between data. if the 50 SMA crosses over it will show gray background, and red if it crosses down.
The Histogram represent Index data.
Best use for Stock Market
릴리즈 노트
makes several housekeeping task, cleaning up unnecessary comments릴리즈 노트
add conditional calculation to check whether today's close is smaller than yesterday'sso visually easier to spot Index Movement
릴리즈 노트
housekeeping task보호된 스크립트입니다
이 스크립트는 비공개 소스로 게시됩니다. 하지만 이를 자유롭게 제한 없이 사용할 수 있습니다 – 자세한 내용은 여기에서 확인하세요.
면책사항
해당 정보와 게시물은 금융, 투자, 트레이딩 또는 기타 유형의 조언이나 권장 사항으로 간주되지 않으며, 트레이딩뷰에서 제공하거나 보증하는 것이 아닙니다. 자세한 내용은 이용 약관을 참조하세요.
보호된 스크립트입니다
이 스크립트는 비공개 소스로 게시됩니다. 하지만 이를 자유롭게 제한 없이 사용할 수 있습니다 – 자세한 내용은 여기에서 확인하세요.
면책사항
해당 정보와 게시물은 금융, 투자, 트레이딩 또는 기타 유형의 조언이나 권장 사항으로 간주되지 않으며, 트레이딩뷰에서 제공하거나 보증하는 것이 아닙니다. 자세한 내용은 이용 약관을 참조하세요.