OPEN-SOURCE SCRIPT
Kumo Implied Volatility
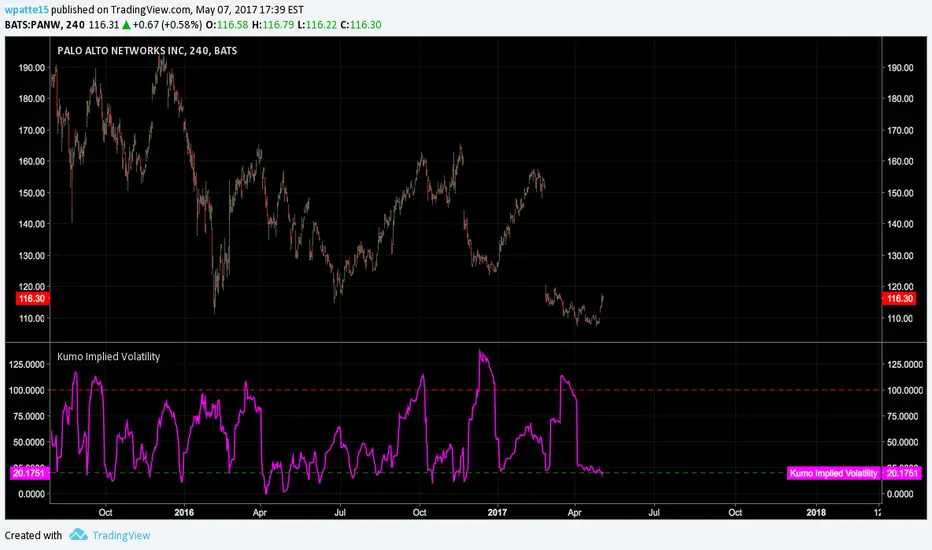
From ProRealCode prorealcode.com/prorealtime-indicators/kumo-implied-volatility/:
"In my pursuit to quantify the Ichimoku indicator, I have tried to quantify implied volatility by measuring the Kumo thickness. Firstly, I took the absolute value of the distance between SpanA and SpanB, I then normalized the value and created standard deviation bands. Now I can compare the Kumo thickness with the average thickness over 200 periods. When the value goes above 100, it implies that the Kumo is thicker than 2 standard deviations of the average (there is therefore only a 5% chance that this happens). A reading over 100 might indicate trend exhaustion and a reading below 20 indicates low volatility and Kumo twists (I chose 20 only by observation and not statistical significance). Interestingly, this indicator sometime gives similar information to ADX. So far, the best use for this indicator is as a setup indicator for trend exhaustion or low volatility breakouts from Kumo twists. Extreme readings before Kumo breakouts looks interesting."
"In my pursuit to quantify the Ichimoku indicator, I have tried to quantify implied volatility by measuring the Kumo thickness. Firstly, I took the absolute value of the distance between SpanA and SpanB, I then normalized the value and created standard deviation bands. Now I can compare the Kumo thickness with the average thickness over 200 periods. When the value goes above 100, it implies that the Kumo is thicker than 2 standard deviations of the average (there is therefore only a 5% chance that this happens). A reading over 100 might indicate trend exhaustion and a reading below 20 indicates low volatility and Kumo twists (I chose 20 only by observation and not statistical significance). Interestingly, this indicator sometime gives similar information to ADX. So far, the best use for this indicator is as a setup indicator for trend exhaustion or low volatility breakouts from Kumo twists. Extreme readings before Kumo breakouts looks interesting."
오픈 소스 스크립트
트레이딩뷰의 진정한 정신에 따라, 이 스크립트의 작성자는 이를 오픈소스로 공개하여 트레이더들이 기능을 검토하고 검증할 수 있도록 했습니다. 작성자에게 찬사를 보냅니다! 이 코드는 무료로 사용할 수 있지만, 코드를 재게시하는 경우 하우스 룰이 적용된다는 점을 기억하세요.
면책사항
해당 정보와 게시물은 금융, 투자, 트레이딩 또는 기타 유형의 조언이나 권장 사항으로 간주되지 않으며, 트레이딩뷰에서 제공하거나 보증하는 것이 아닙니다. 자세한 내용은 이용 약관을 참조하세요.
오픈 소스 스크립트
트레이딩뷰의 진정한 정신에 따라, 이 스크립트의 작성자는 이를 오픈소스로 공개하여 트레이더들이 기능을 검토하고 검증할 수 있도록 했습니다. 작성자에게 찬사를 보냅니다! 이 코드는 무료로 사용할 수 있지만, 코드를 재게시하는 경우 하우스 룰이 적용된다는 점을 기억하세요.
면책사항
해당 정보와 게시물은 금융, 투자, 트레이딩 또는 기타 유형의 조언이나 권장 사항으로 간주되지 않으며, 트레이딩뷰에서 제공하거나 보증하는 것이 아닙니다. 자세한 내용은 이용 약관을 참조하세요.