OPEN-SOURCE SCRIPT
Circuit % Marker w/ Mirrored Arrows
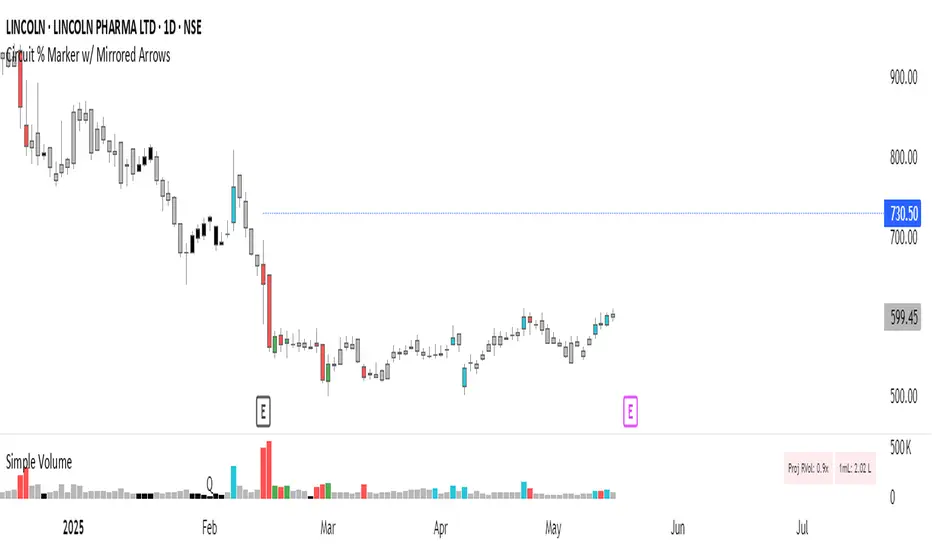
📈 Indian Market Circuit Limit Change Tracker
This indicator automatically tracks circuit limit changes (price bands) as applied in NSE/BSE stocks.
🧠 How It Works:
Start from a user-defined initial circuit limit (e.g. 10%)
If the upper or lower limit is hit, the script waits for a user-defined cooling period (e.g. 5 trading days)
After that, it automatically adjusts to the next lower or higher band (e.g. from 10% to 5%)
Shows a visual label with the current circuit % right on the chart — placed above or below candles for better visibility
🔧 Custom Inputs:
Starting Circuit % — choose between standard NSE/BSE values (20%, 10%, 5%, 2%)
Cooling Days — how many days must pass after a circuit hit before it’s allowed to change again
Label Positioning, Color, and Size — fully customizable to suit your chart style
🚫 No Clutter:
Doesn’t draw circuit limit lines
Just clean, small labels at key turning points — as seen in real trading dashboards
🔍 Notes:
NSE and BSE manually assign circuit bands — this script does not fetch live exchange data
Use it as a visual tracker and simulator of how circuit behavior would evolve under fixed rules
오픈 소스 스크립트
트레이딩뷰의 진정한 정신에 따라, 이 스크립트의 작성자는 이를 오픈소스로 공개하여 트레이더들이 기능을 검토하고 검증할 수 있도록 했습니다. 작성자에게 찬사를 보냅니다! 이 코드는 무료로 사용할 수 있지만, 코드를 재게시하는 경우 하우스 룰이 적용된다는 점을 기억하세요.
면책사항
해당 정보와 게시물은 금융, 투자, 트레이딩 또는 기타 유형의 조언이나 권장 사항으로 간주되지 않으며, 트레이딩뷰에서 제공하거나 보증하는 것이 아닙니다. 자세한 내용은 이용 약관을 참조하세요.
오픈 소스 스크립트
트레이딩뷰의 진정한 정신에 따라, 이 스크립트의 작성자는 이를 오픈소스로 공개하여 트레이더들이 기능을 검토하고 검증할 수 있도록 했습니다. 작성자에게 찬사를 보냅니다! 이 코드는 무료로 사용할 수 있지만, 코드를 재게시하는 경우 하우스 룰이 적용된다는 점을 기억하세요.
면책사항
해당 정보와 게시물은 금융, 투자, 트레이딩 또는 기타 유형의 조언이나 권장 사항으로 간주되지 않으며, 트레이딩뷰에서 제공하거나 보증하는 것이 아닙니다. 자세한 내용은 이용 약관을 참조하세요.