PROTECTED SOURCE SCRIPT
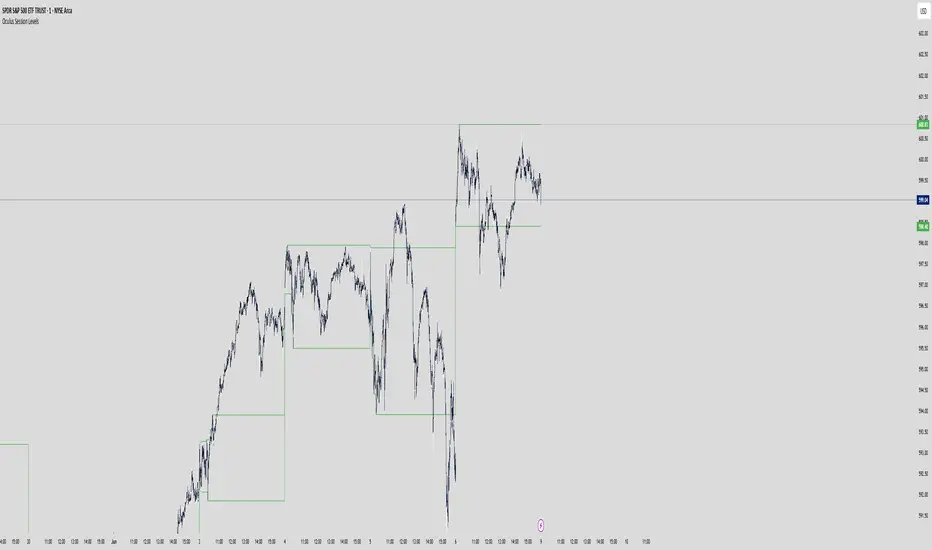
Oculus Session Levels
Oculus Session Levels
The Oculus Session Levels indicator is designed to help traders track key price levels during important market sessions: Pre-Market, Futures, and the New York Open. By marking these levels on your chart, it provides clear reference points for potential price action and breakout opportunities as the market progresses through its various phases.
Key Features:
Pre-Market High & Low: The indicator calculates and displays the highest and lowest prices during the pre-market session (from 4:00 AM to 9:30 AM EST). These levels are important for gauging potential support or resistance when the market opens.
Futures First Hour High & Low: It tracks the first hour of futures trading (from 6:00 PM to 7:00 PM EST), marking the high and low levels that can serve as important reference points for the following trading day.
New York Open High & Low: The indicator also tracks the high and low during the first hour of the New York market open (from 9:30 AM to 10:30 AM EST), providing critical levels that traders use to identify trends or reversals in the early stages of the trading day.
How to Use:
Pre-Market High & Low:
These levels are calculated before the regular market opens. Price movements near these levels after the market opens may indicate potential breakout or reversal zones.
Futures High & Low:
These levels track the overnight futures session. The price range within this session can provide insight into how the market might behave during regular trading hours.
NY Open High & Low:
The first hour of the New York session is critical for establishing market direction. Prices near these levels can signify the start of a strong trend or possible pullback.
Visual Representation:
Pre-Market High & Low: Plotted in blue.
Futures High & Low: Plotted in orange.
NY Open High & Low: Plotted in green.
These levels are updated daily, providing fresh insights based on the latest market data. The Oculus Session Levels indicator gives traders a simple but powerful tool for understanding market context and planning their trades more effectively.
보호된 스크립트입니다
이 스크립트는 비공개 소스로 게시됩니다. 하지만 이를 자유롭게 제한 없이 사용할 수 있습니다 – 자세한 내용은 여기에서 확인하세요.
면책사항
해당 정보와 게시물은 금융, 투자, 트레이딩 또는 기타 유형의 조언이나 권장 사항으로 간주되지 않으며, 트레이딩뷰에서 제공하거나 보증하는 것이 아닙니다. 자세한 내용은 이용 약관을 참조하세요.
보호된 스크립트입니다
이 스크립트는 비공개 소스로 게시됩니다. 하지만 이를 자유롭게 제한 없이 사용할 수 있습니다 – 자세한 내용은 여기에서 확인하세요.
면책사항
해당 정보와 게시물은 금융, 투자, 트레이딩 또는 기타 유형의 조언이나 권장 사항으로 간주되지 않으며, 트레이딩뷰에서 제공하거나 보증하는 것이 아닙니다. 자세한 내용은 이용 약관을 참조하세요.