PROTECTED SOURCE SCRIPT
TDI (by Will)

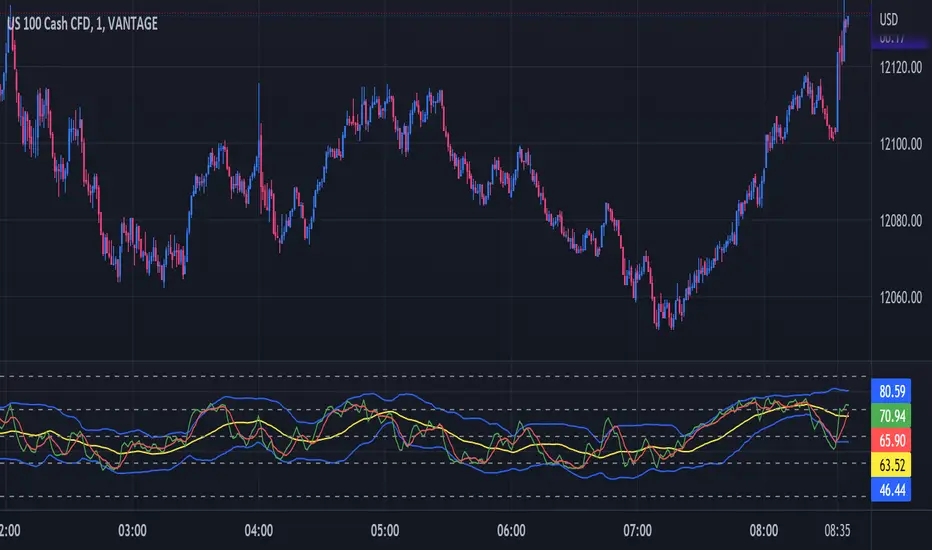
The TDI is a complex indicator as long as it is based on three other popular indicators: the RSI , Moving Average, and Bollinger Bands .
The RSI helps to find out whether the current trade is "overheated". The RSI lines are smoothed out by the Moving Averages. The Bollinger Bands help to assess the oscillation amplitude of the price and the direction of the trend. Thanks to being complex, the TDI may be used as a separate trading system.
The TDI is drawn in a window below the price chart and consists of five lines: two RSI lines and three Bollinger Bands . The green RSI line is called fast, the red one is signal - it is calculated based on a longer averaging period. The RSI lines show the strength and volatility of the market. When they cross, they give short-term TDI signals.
Two of the Bollinger Bands are blue, they constitute a trading channel; the yellow line is called the middle, or main, line. The central axis of the indicator is level 50; levels 32 and 68 are also marked. The area above 68 is the overbought zone and the area below 32 is the oversold zone, as in the classical RSI .
보호된 스크립트입니다
이 스크립트는 비공개 소스로 게시됩니다. 하지만 이를 자유롭게 제한 없이 사용할 수 있습니다 – 자세한 내용은 여기에서 확인하세요.
면책사항
해당 정보와 게시물은 금융, 투자, 트레이딩 또는 기타 유형의 조언이나 권장 사항으로 간주되지 않으며, 트레이딩뷰에서 제공하거나 보증하는 것이 아닙니다. 자세한 내용은 이용 약관을 참조하세요.
보호된 스크립트입니다
이 스크립트는 비공개 소스로 게시됩니다. 하지만 이를 자유롭게 제한 없이 사용할 수 있습니다 – 자세한 내용은 여기에서 확인하세요.
면책사항
해당 정보와 게시물은 금융, 투자, 트레이딩 또는 기타 유형의 조언이나 권장 사항으로 간주되지 않으며, 트레이딩뷰에서 제공하거나 보증하는 것이 아닙니다. 자세한 내용은 이용 약관을 참조하세요.