OPEN-SOURCE SCRIPT
Ehlers Universal Oscillator [LazyBear]
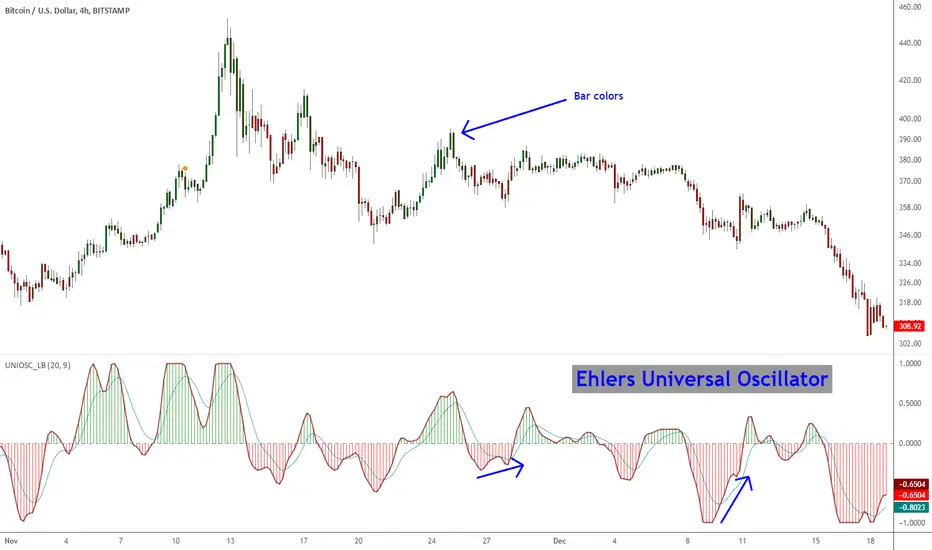
Universal Oscillator by Mr. Ehlers is an evolution of his SuperSmoother filter. The new indicator follows the swings in price without introducing extra delay.
It is controlled through one single input – the band edge – which basically is frequency. The smaller it is set, the less lag there is, but you may see lot of whipsaws. Built-in automatic gain control normalizes the output to vary between the range of -1 to +1.
Mr. Ehlers suggests a straightforward system:
- Buy when long-term Universal Oscillator crosses above zero
- Sell when long-term Universal Oscillator crosses below zero
I have added options to draw a signal line, histogram and bar coloring. Bar coloring, if enabled, is done using the histogram color, but you can change it easily to signal_cross by uncommenting a line (check the source).
More info:
[S&C 2015/01] Whiter is Brighter - Ehlers
List of my other indicators:
- GDoc: docs.google.com/document/d/15AGCufJZ8CIUvwFJ9W-IKns88gkWOKBCvByMEvm5MLo/edit?usp=sharing
- Chart: tradingview.com/v/4IneGo8h/
오픈 소스 스크립트
트레이딩뷰의 진정한 정신에 따라, 이 스크립트의 작성자는 이를 오픈소스로 공개하여 트레이더들이 기능을 검토하고 검증할 수 있도록 했습니다. 작성자에게 찬사를 보냅니다! 이 코드는 무료로 사용할 수 있지만, 코드를 재게시하는 경우 하우스 룰이 적용된다는 점을 기억하세요.
List of my free indicators: bit.ly/1LQaPK8
List of my indicators at Appstore: blog.tradingview.com/?p=970
List of my indicators at Appstore: blog.tradingview.com/?p=970
면책사항
해당 정보와 게시물은 금융, 투자, 트레이딩 또는 기타 유형의 조언이나 권장 사항으로 간주되지 않으며, 트레이딩뷰에서 제공하거나 보증하는 것이 아닙니다. 자세한 내용은 이용 약관을 참조하세요.