OPEN-SOURCE SCRIPT
Chart Mojo Neutral Unwound Cloud
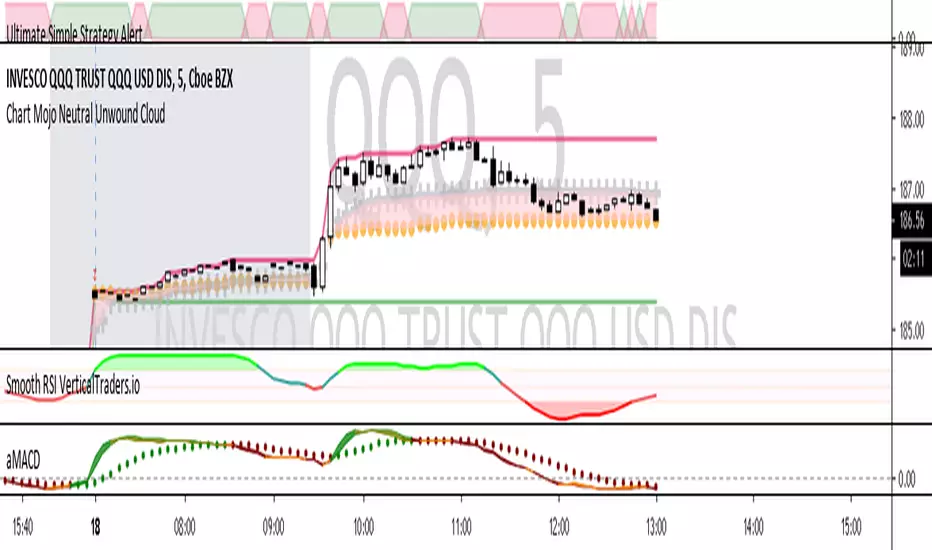
Plots days high/low and the Chart Mojo neutral cloud, the zone between vwap and 50% range. A secondary gravity right behind the opening 1 min range. The gray crosses are the vwap the gold dots are 50% of developing range. The shaded area between vwap and 50% range is the Chart Mojo cloud...I think of it as traders from the open tend to unwind to it many times a day. More returns on a trend day but you will see urges toward it on trend days. Price tends to urge to it ahead of 10:30 session "1" and 1:15 Session 2. If you get used to watching it and its relationship to price and the opening 1 min range you should start to see tendencies as to when price unwinds toward it.. etc. Where price is in relation to the cloud and the clouds relationship to the opening 1 min range can reveal real time bias. You will being to see, upon observation how traders target the vwap and 50% with target tier of buys and sells etc. Often unwinds to the zones gravity. It takes force or a catalyst to break the gravity. I use it in conjuction with Time Zone theory and Wave and Pattern force...and look to leading correlating hi beta movers and internals like tick and new streaming highs-new straming lows to get jump on what you see on a big etf or index etc. If you intraday tendencies the neutral is very helpful.
오픈 소스 스크립트
트레이딩뷰의 진정한 정신에 따라, 이 스크립트의 작성자는 이를 오픈소스로 공개하여 트레이더들이 기능을 검토하고 검증할 수 있도록 했습니다. 작성자에게 찬사를 보냅니다! 이 코드는 무료로 사용할 수 있지만, 코드를 재게시하는 경우 하우스 룰이 적용된다는 점을 기억하세요.
면책사항
해당 정보와 게시물은 금융, 투자, 트레이딩 또는 기타 유형의 조언이나 권장 사항으로 간주되지 않으며, 트레이딩뷰에서 제공하거나 보증하는 것이 아닙니다. 자세한 내용은 이용 약관을 참조하세요.
오픈 소스 스크립트
트레이딩뷰의 진정한 정신에 따라, 이 스크립트의 작성자는 이를 오픈소스로 공개하여 트레이더들이 기능을 검토하고 검증할 수 있도록 했습니다. 작성자에게 찬사를 보냅니다! 이 코드는 무료로 사용할 수 있지만, 코드를 재게시하는 경우 하우스 룰이 적용된다는 점을 기억하세요.
면책사항
해당 정보와 게시물은 금융, 투자, 트레이딩 또는 기타 유형의 조언이나 권장 사항으로 간주되지 않으며, 트레이딩뷰에서 제공하거나 보증하는 것이 아닙니다. 자세한 내용은 이용 약관을 참조하세요.