OPEN-SOURCE SCRIPT
업데이트됨 ADL Price Ratio
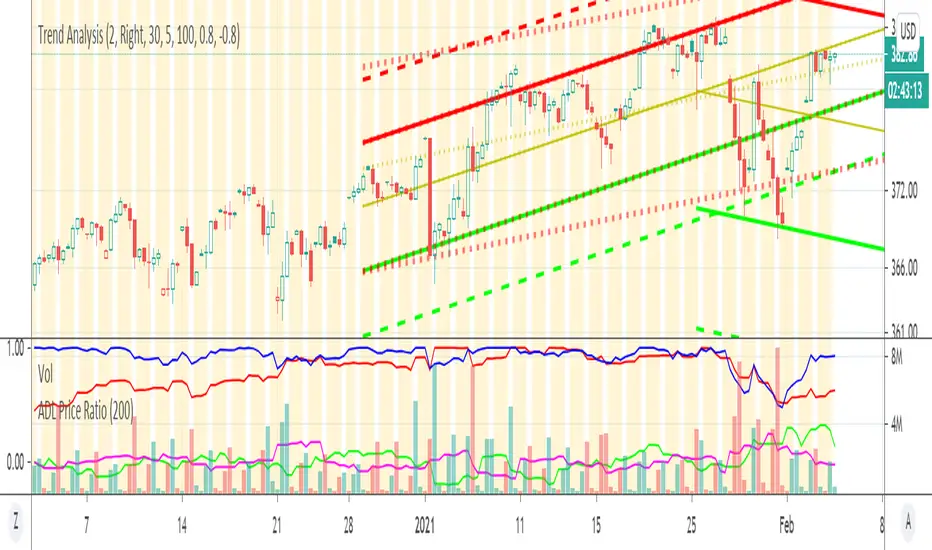
This script measures percentage of ADL movement relative and difference to Stock Price movement, in a core this measure reflects "how in-the-market (ADL) volume moves Stock Price".
The higher green line, the easier prices moves higher, the smaller black line (ADL - Price difference) the more price reflects volume movements (e.g. ADL up -> Stock Price up same amount)
The higher green line, the easier prices moves higher, the smaller black line (ADL - Price difference) the more price reflects volume movements (e.g. ADL up -> Stock Price up same amount)
릴리즈 노트
- Removed moving averages which were cluttering chart릴리즈 노트
Updated scenario when percent reaches 100% and thus difference with previous may be incorrect if ATH being hit continuously. As a result more accurate buyer/seller pressure on price is reflected (green vs magenta lines)On high level if green line (buyer AD moving price higher easily) higher than magenta (seller AD moving price down easily) and AD (red line) is going higher that means price moves higher on lower volume (ease of pressure to downward)
오픈 소스 스크립트
트레이딩뷰의 진정한 정신에 따라, 이 스크립트의 작성자는 이를 오픈소스로 공개하여 트레이더들이 기능을 검토하고 검증할 수 있도록 했습니다. 작성자에게 찬사를 보냅니다! 이 코드는 무료로 사용할 수 있지만, 코드를 재게시하는 경우 하우스 룰이 적용된다는 점을 기억하세요.
면책사항
해당 정보와 게시물은 금융, 투자, 트레이딩 또는 기타 유형의 조언이나 권장 사항으로 간주되지 않으며, 트레이딩뷰에서 제공하거나 보증하는 것이 아닙니다. 자세한 내용은 이용 약관을 참조하세요.
오픈 소스 스크립트
트레이딩뷰의 진정한 정신에 따라, 이 스크립트의 작성자는 이를 오픈소스로 공개하여 트레이더들이 기능을 검토하고 검증할 수 있도록 했습니다. 작성자에게 찬사를 보냅니다! 이 코드는 무료로 사용할 수 있지만, 코드를 재게시하는 경우 하우스 룰이 적용된다는 점을 기억하세요.
면책사항
해당 정보와 게시물은 금융, 투자, 트레이딩 또는 기타 유형의 조언이나 권장 사항으로 간주되지 않으며, 트레이딩뷰에서 제공하거나 보증하는 것이 아닙니다. 자세한 내용은 이용 약관을 참조하세요.