PROTECTED SOURCE SCRIPT
LIQUID-VOL-DISP-INDIC
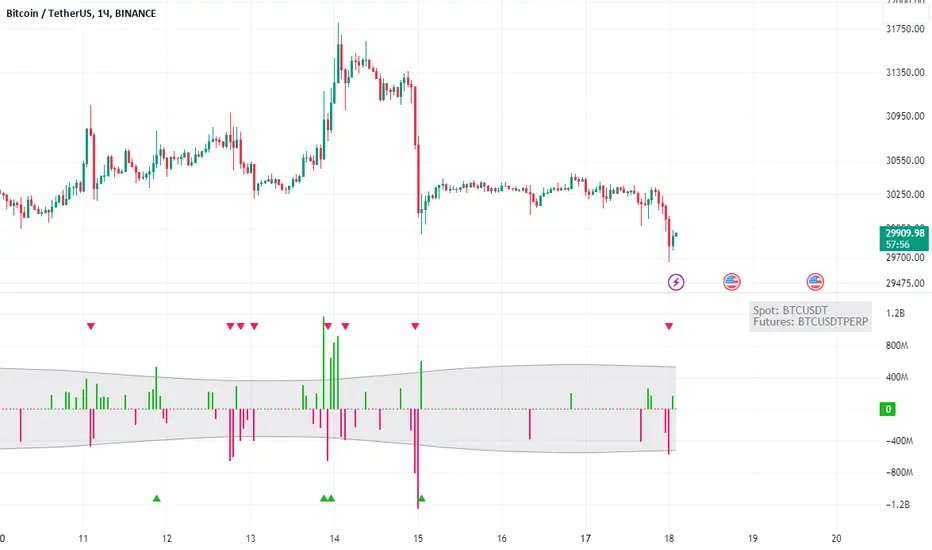
The "Liquidation Volume Disparity Indicator" indicator, is a tool designed to analyze the volume disparity between spot and futures markets. It aims to identify potential liquidation events that may have occurred based on the difference in trading volume.
The indicator calculates the difference between the volume of the spot market and the volume of the futures market. Positive values indicate a higher volume in the futures market compared to the spot market, while negative values suggest higher volume in the spot market.
Key Features:
Automatic Ticker Detection: The indicator can dynamically detect the spot and futures markets corresponding to the current symbol, ensuring accurate data representation.
Binance as the Default Source: By default, Binance is used as the data source for perpetuals. This can be overridden if needed.
Manual Ticker Selection: Users have the flexibility to manually select the symbols for the spot and futures markets if autodetection is disabled.
Stop-Loss Level Adjustment: The indicator allows users to adjust the stop-loss level based on the average band of liquidations. By increasing the multiplier, the stop-loss level can be set higher than the average, providing risk management flexibility.
Aesthetic Customization: Users can customize the color scheme for long and short liquidations, choose to display spot and futures market volumes, and adjust various visual elements for enhanced readability.
By plotting the liquidation volume disparity on the chart, the indicator provides valuable insights into potential market dynamics. Traders can utilize this information to better understand the relationship between spot and futures markets, identify possible liquidation events, and potentially incorporate it into their trading strategies.
Additionally, the indicator generates alerts for long and short exit signals based on the detected stop-loss levels, providing timely notifications to traders for potential trade management actions.
보호된 스크립트입니다
이 스크립트는 비공개 소스로 게시됩니다. 하지만 제한 없이 자유롭게 사용할 수 있습니다 — 여기에서 자세히 알아보기.
면책사항
이 정보와 게시물은 TradingView에서 제공하거나 보증하는 금융, 투자, 거래 또는 기타 유형의 조언이나 권고 사항을 의미하거나 구성하지 않습니다. 자세한 내용은 이용 약관을 참고하세요.
보호된 스크립트입니다
이 스크립트는 비공개 소스로 게시됩니다. 하지만 제한 없이 자유롭게 사용할 수 있습니다 — 여기에서 자세히 알아보기.
면책사항
이 정보와 게시물은 TradingView에서 제공하거나 보증하는 금융, 투자, 거래 또는 기타 유형의 조언이나 권고 사항을 의미하거나 구성하지 않습니다. 자세한 내용은 이용 약관을 참고하세요.