PROTECTED SOURCE SCRIPT
업데이트됨 Vol-Sensitivity Ratio: dVIX% / dSPX%
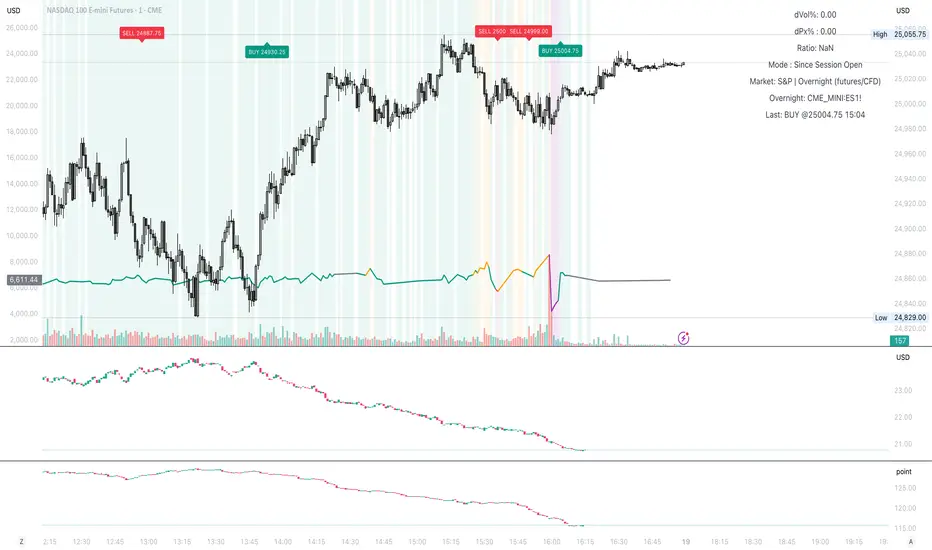
Vol-Sensitivity Ratio: dVIX% / dSPX%
Hey guys — I built a custom TradingView indicator to track how reactive the VIX is to SPX moves.
It’s basically a quick visual on market fear vs. complacency, and how volatility responds in real time.
How It Works
Calculates the ratio of VIX % change ÷ SPX % change
Shows color-coded zones for market behavior:
🔴 SPX & VIX rising → Bearish divergence
🟠 Weak VIX response → Complacency
🟩 Normal inverse → Healthy market
🟣 Extreme ratio → Volatility stress
How to Use
Add the script to your TradingView chart
Choose mode → Since Session Open (intraday) or From Prior Close (swing)
Watch the ratio line, color bands, and mini dashboard (shows dVIX%, dSPX%, and ratio)
It also supports alerts for when the market enters stress, divergence, or complacency zones.
Why I Made It
Hek often talks about VIX, VVIX, and volatility dynamics during trading.
That got me thinking about how to actually quantify the relationship instead of just “watching” it.
thanks to chatgpt I was able to turn into a visual
Now I’ll be forward-testing it in live markets and on a few prop accounts to see how useful it is in real-time conditions.
Feel free to try it out, tweak it, and share feedback or observations. Would love to see how it performs for others too.
릴리즈 노트
updated릴리즈 노트
Live signals etc.릴리즈 노트
More updates보호된 스크립트입니다
이 스크립트는 비공개 소스로 게시됩니다. 하지만 이를 자유롭게 제한 없이 사용할 수 있습니다 – 자세한 내용은 여기에서 확인하세요.
면책사항
해당 정보와 게시물은 금융, 투자, 트레이딩 또는 기타 유형의 조언이나 권장 사항으로 간주되지 않으며, 트레이딩뷰에서 제공하거나 보증하는 것이 아닙니다. 자세한 내용은 이용 약관을 참조하세요.
면책사항
해당 정보와 게시물은 금융, 투자, 트레이딩 또는 기타 유형의 조언이나 권장 사항으로 간주되지 않으며, 트레이딩뷰에서 제공하거나 보증하는 것이 아닙니다. 자세한 내용은 이용 약관을 참조하세요.