OPEN-SOURCE SCRIPT
Day of Week Performance
█ OVERVIEW
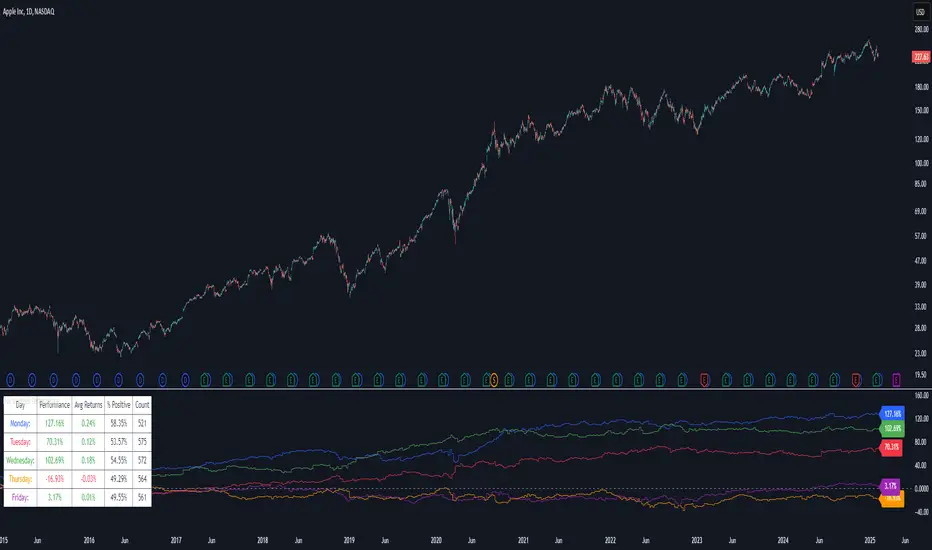
The Day of Week Performance indicator is designed to visualise and compare the cumulative percentage change for each day of the week. This indicator explores one of the many calendar based anomalies in financial markets.
In financial analysis, a calendar based anomaly refers to recurring patterns or tendencies associated with specific time periods, such as days of the week. By calculating the cumulative percentage change for each day (Monday through Friday) and displaying the results both graphically and in a summary table, this indicator helps identify whether certain days consistently outperform others.
█ FEATURES
█ HOW TO USE
Colour Scheme:
The Day of Week Performance indicator is designed to visualise and compare the cumulative percentage change for each day of the week. This indicator explores one of the many calendar based anomalies in financial markets.
In financial analysis, a calendar based anomaly refers to recurring patterns or tendencies associated with specific time periods, such as days of the week. By calculating the cumulative percentage change for each day (Monday through Friday) and displaying the results both graphically and in a summary table, this indicator helps identify whether certain days consistently outperform others.
█ FEATURES
- Customisable time window via Time Settings.
- Calculates cumulative percentage change for each day (Monday to Friday) separately.
- Option to use Sunday instead of Friday for CFDs and Futures analysis.
- Distinct visual representation for each day using unique colours.
- Customisable table settings including position and font size.
- Built-in error checks to ensure the indicator is applied on a Daily timeframe.
█ HOW TO USE
- Add the indicator to a chart set to a Daily timeframe.
- Select your desired Start Time and End Time in the Time Settings.
- Toggle the performance table on or off in the Table Settings.
- Adjust the table’s location and font size as needed.
- Use the "Use Sunday instead of Friday" option if your market requires it.
- View the cumulative performance plotted in distinct colours.
Colour Scheme:
- Monday: Blue
- Tuesday: Red
- Wednesday: Green
- Thursday: Orange
- Friday: Purple
오픈 소스 스크립트
트레이딩뷰의 진정한 정신에 따라, 이 스크립트의 작성자는 이를 오픈소스로 공개하여 트레이더들이 기능을 검토하고 검증할 수 있도록 했습니다. 작성자에게 찬사를 보냅니다! 이 코드는 무료로 사용할 수 있지만, 코드를 재게시하는 경우 하우스 룰이 적용된다는 점을 기억하세요.
면책사항
해당 정보와 게시물은 금융, 투자, 트레이딩 또는 기타 유형의 조언이나 권장 사항으로 간주되지 않으며, 트레이딩뷰에서 제공하거나 보증하는 것이 아닙니다. 자세한 내용은 이용 약관을 참조하세요.
오픈 소스 스크립트
트레이딩뷰의 진정한 정신에 따라, 이 스크립트의 작성자는 이를 오픈소스로 공개하여 트레이더들이 기능을 검토하고 검증할 수 있도록 했습니다. 작성자에게 찬사를 보냅니다! 이 코드는 무료로 사용할 수 있지만, 코드를 재게시하는 경우 하우스 룰이 적용된다는 점을 기억하세요.
면책사항
해당 정보와 게시물은 금융, 투자, 트레이딩 또는 기타 유형의 조언이나 권장 사항으로 간주되지 않으며, 트레이딩뷰에서 제공하거나 보증하는 것이 아닙니다. 자세한 내용은 이용 약관을 참조하세요.