OPEN-SOURCE SCRIPT
업데이트됨 Price Mapper
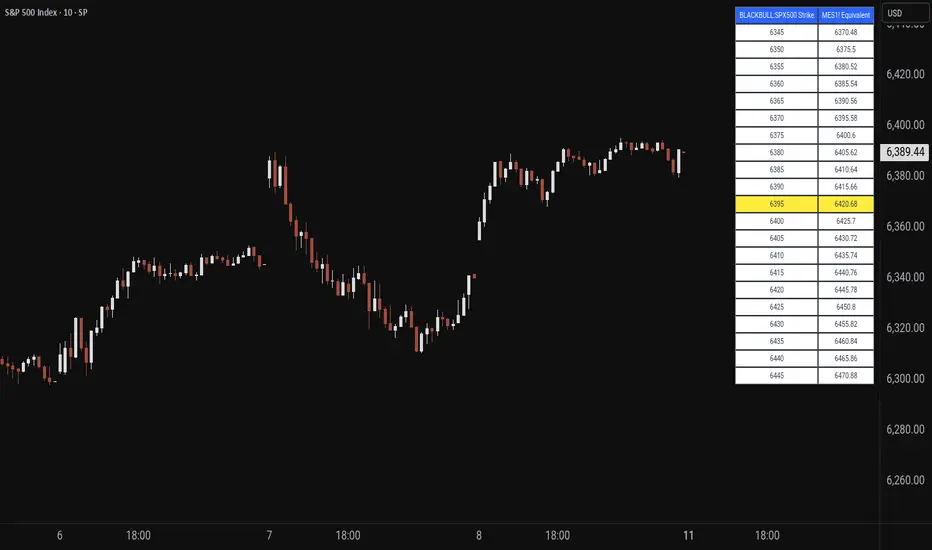
Price Mapper is a dynamic trading tool designed to map strike prices between two related financial instruments using real-time ratio calculations. The indicator displays a customizable table showing strike levels for your primary ticker alongside their equivalent mapped prices for a secondary instrument, making it invaluable for cross-market analysis, pairs trading, and hedging strategies. Whether you're comparing an ETF to its underlying futures, analyzing currency pairs, or exploring relationships between correlated assets, Price Mapper provides instant visual mapping of how price movements in one instrument translate to equivalent levels in another. The ratio calculation updates daily using 12:00 PM New York time closing prices, ensuring consistent reference points while maintaining relevance to current market conditions.
The tool automatically centers around the current market price and allows complete customization of display parameters including strike increments, number of price levels, decimal precision, and table positioning. Advanced color customization options let you highlight the current price level and adjust the appearance to match your trading setup. Price Mapper eliminates the mental math typically required when trading related instruments, instantly showing you equivalent entry and exit levels across different markets. This makes it particularly powerful for options traders working with ETFs and futures, forex traders analyzing currency correlations, or any trader looking to understand precise price relationships between connected financial instruments.
The tool automatically centers around the current market price and allows complete customization of display parameters including strike increments, number of price levels, decimal precision, and table positioning. Advanced color customization options let you highlight the current price level and adjust the appearance to match your trading setup. Price Mapper eliminates the mental math typically required when trading related instruments, instantly showing you equivalent entry and exit levels across different markets. This makes it particularly powerful for options traders working with ETFs and futures, forex traders analyzing currency correlations, or any trader looking to understand precise price relationships between connected financial instruments.
릴리즈 노트
Made presets for GOLD And SP500 but still left the option for any custom tickers as well.릴리즈 노트
updated the picture so its relevant with the indicator again.릴리즈 노트
Added a textsize option in the settings오픈 소스 스크립트
트레이딩뷰의 진정한 정신에 따라, 이 스크립트의 작성자는 이를 오픈소스로 공개하여 트레이더들이 기능을 검토하고 검증할 수 있도록 했습니다. 작성자에게 찬사를 보냅니다! 이 코드는 무료로 사용할 수 있지만, 코드를 재게시하는 경우 하우스 룰이 적용된다는 점을 기억하세요.
면책사항
해당 정보와 게시물은 금융, 투자, 트레이딩 또는 기타 유형의 조언이나 권장 사항으로 간주되지 않으며, 트레이딩뷰에서 제공하거나 보증하는 것이 아닙니다. 자세한 내용은 이용 약관을 참조하세요.
오픈 소스 스크립트
트레이딩뷰의 진정한 정신에 따라, 이 스크립트의 작성자는 이를 오픈소스로 공개하여 트레이더들이 기능을 검토하고 검증할 수 있도록 했습니다. 작성자에게 찬사를 보냅니다! 이 코드는 무료로 사용할 수 있지만, 코드를 재게시하는 경우 하우스 룰이 적용된다는 점을 기억하세요.
면책사항
해당 정보와 게시물은 금융, 투자, 트레이딩 또는 기타 유형의 조언이나 권장 사항으로 간주되지 않으며, 트레이딩뷰에서 제공하거나 보증하는 것이 아닙니다. 자세한 내용은 이용 약관을 참조하세요.