OPEN-SOURCE SCRIPT
GAP Bands
""
Introduction
Gap trading is a simple and disciplined approach to buying and shorting stocks. Essentially, one finds stocks that have a price gap from the previous close, then watches the first hour of trading to identify the trading range. Rising above that range signals a buy, while falling below it signals a short.
What is a Gap?
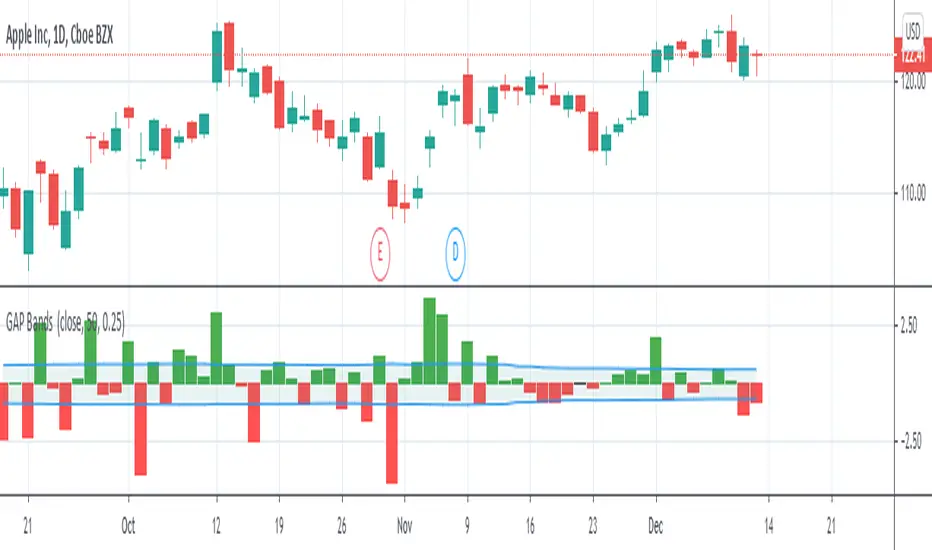
A gap is a change in price levels between the close and open of two consecutive days. Although most technical analysis manuals define the four types of gap patterns as Common, Breakaway, Continuation and Exhaustion, those labels are applied after the chart pattern is established. That is, the difference between any one type of gap from another is only distinguishable after the stock continues up or down in some fashion. Although those classifications are useful for a longer-term understanding of how a particular stock or sector reacts, they offer little guidance for trading.""" (Definition from StockCharts)
I plot gaps and add a band to them with volatility to make a decision about how important the current gap in terms of our price movement.
Introduction
Gap trading is a simple and disciplined approach to buying and shorting stocks. Essentially, one finds stocks that have a price gap from the previous close, then watches the first hour of trading to identify the trading range. Rising above that range signals a buy, while falling below it signals a short.
What is a Gap?
A gap is a change in price levels between the close and open of two consecutive days. Although most technical analysis manuals define the four types of gap patterns as Common, Breakaway, Continuation and Exhaustion, those labels are applied after the chart pattern is established. That is, the difference between any one type of gap from another is only distinguishable after the stock continues up or down in some fashion. Although those classifications are useful for a longer-term understanding of how a particular stock or sector reacts, they offer little guidance for trading.""" (Definition from StockCharts)
I plot gaps and add a band to them with volatility to make a decision about how important the current gap in terms of our price movement.
오픈 소스 스크립트
트레이딩뷰의 진정한 정신에 따라, 이 스크립트의 작성자는 이를 오픈소스로 공개하여 트레이더들이 기능을 검토하고 검증할 수 있도록 했습니다. 작성자에게 찬사를 보냅니다! 이 코드는 무료로 사용할 수 있지만, 코드를 재게시하는 경우 하우스 룰이 적용된다는 점을 기억하세요.
면책사항
해당 정보와 게시물은 금융, 투자, 트레이딩 또는 기타 유형의 조언이나 권장 사항으로 간주되지 않으며, 트레이딩뷰에서 제공하거나 보증하는 것이 아닙니다. 자세한 내용은 이용 약관을 참조하세요.
오픈 소스 스크립트
트레이딩뷰의 진정한 정신에 따라, 이 스크립트의 작성자는 이를 오픈소스로 공개하여 트레이더들이 기능을 검토하고 검증할 수 있도록 했습니다. 작성자에게 찬사를 보냅니다! 이 코드는 무료로 사용할 수 있지만, 코드를 재게시하는 경우 하우스 룰이 적용된다는 점을 기억하세요.
면책사항
해당 정보와 게시물은 금융, 투자, 트레이딩 또는 기타 유형의 조언이나 권장 사항으로 간주되지 않으며, 트레이딩뷰에서 제공하거나 보증하는 것이 아닙니다. 자세한 내용은 이용 약관을 참조하세요.