PROTECTED SOURCE SCRIPT
Pro Maker Prev Month Wick High/Low
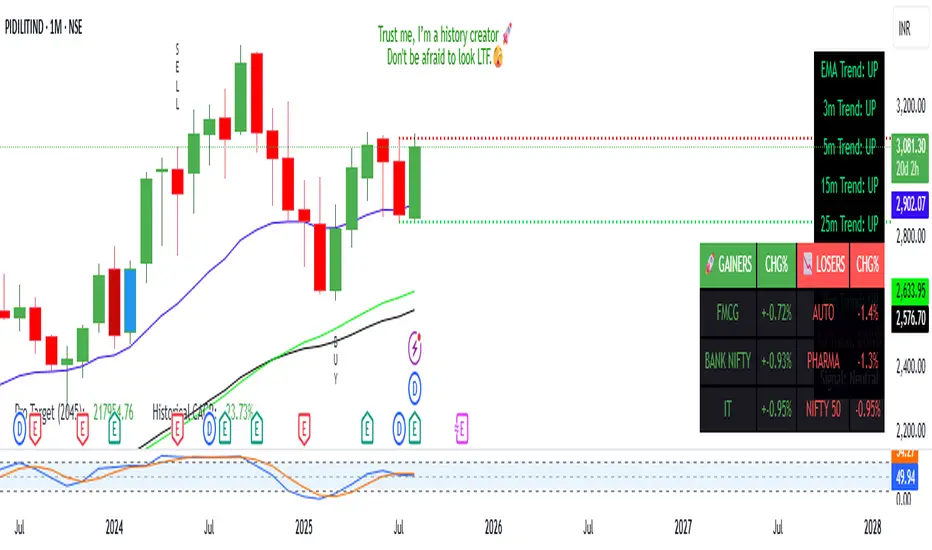
This indicator plots the exact Previous Month’s Wick High & Wick Low on the chart.
Levels are fixed across all timeframes (M1 to M).
High/Low lines start exactly from the first bar of the previous month and extend to the right.
Perfect for identifying important swing points and supply/demand zones.
Features:
Auto-updates at the start of a new month.
Works on any symbol & any timeframe.
Clean dotted-line visuals with color-coded High (Red) & Low (Green).
Use case:
Quickly see where the previous month’s extreme levels were.
Combine with price action or breakout strategies for higher accuracy.
보호된 스크립트입니다
이 스크립트는 비공개 소스로 게시됩니다. 하지만 이를 자유롭게 제한 없이 사용할 수 있습니다 – 자세한 내용은 여기에서 확인하세요.
면책사항
해당 정보와 게시물은 금융, 투자, 트레이딩 또는 기타 유형의 조언이나 권장 사항으로 간주되지 않으며, 트레이딩뷰에서 제공하거나 보증하는 것이 아닙니다. 자세한 내용은 이용 약관을 참조하세요.
보호된 스크립트입니다
이 스크립트는 비공개 소스로 게시됩니다. 하지만 이를 자유롭게 제한 없이 사용할 수 있습니다 – 자세한 내용은 여기에서 확인하세요.
면책사항
해당 정보와 게시물은 금융, 투자, 트레이딩 또는 기타 유형의 조언이나 권장 사항으로 간주되지 않으며, 트레이딩뷰에서 제공하거나 보증하는 것이 아닙니다. 자세한 내용은 이용 약관을 참조하세요.