OPEN-SOURCE SCRIPT
업데이트됨 SMA Direction Cross Currency Summary
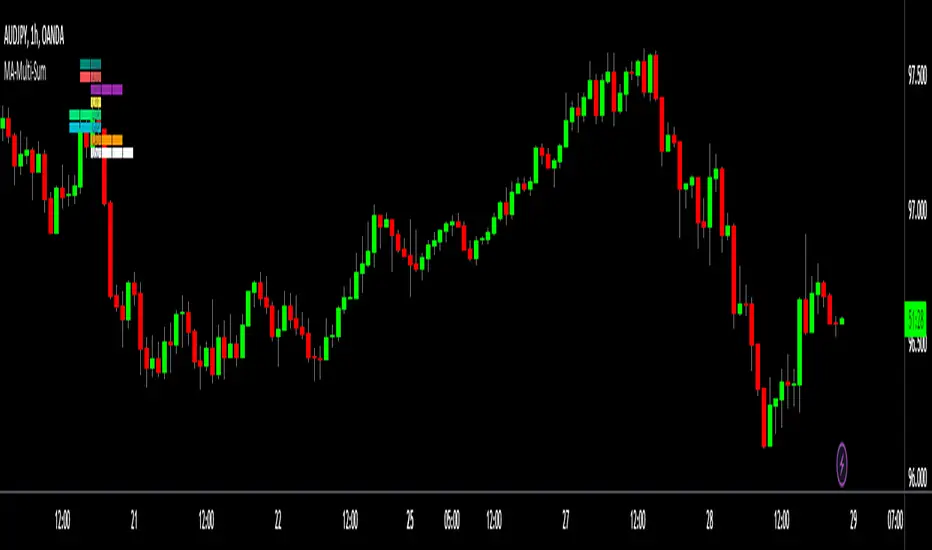
This script shows the average SMA direction of each of the majors and crosses when compared to each other. The more blocks to the right the stronger the currency on that timeframe. The more blocks to the left the weaker the currency.
I'm finding it useful to quickly know the average flow of movement for each currency on the higher timeframes and then focus on that for a daily trade. I also like how i dont have to keep jumping between instruments to stay upto date. I'm not a 'real' trader so I have very limited time and attention for this so this does the job as a crude replacement for trawling all the chart each day.

The currencies compared are:
-NZD
-AUD
-JPY
-CHF
-EUR
-GBP
-CAD
-USD
The way it is calculated is that its based on the 20 SMA. For each currency vs the other crosses:
if the SMA is pointing up and price is higher = +2
if the SMA is pointing up and price is lower = +1
if the SMA is pointing down and price is higher = -2
if the SMA is pointing down and price is lower = -1
So if we where considering GBP. We would do that for GBPNZD, GBPAUD, GBPPJY, GBPCHF, GBPEUR, GBPCAD, GBPUSD. We would then consider this sum against all the currencies to understand the relative strength.
Due to the limit on how many instruments can be called in a single indicated you need to load it for each currencies so 8 currencies = 8 indicators.
Its a bit of a frankinstien script - it just throw it togeather so its probably got redundant code etc. Its built around 20 SMA - no idea what would happens when you change that.
I'm finding it useful to quickly know the average flow of movement for each currency on the higher timeframes and then focus on that for a daily trade. I also like how i dont have to keep jumping between instruments to stay upto date. I'm not a 'real' trader so I have very limited time and attention for this so this does the job as a crude replacement for trawling all the chart each day.
The currencies compared are:
-NZD
-AUD
-JPY
-CHF
-EUR
-GBP
-CAD
-USD
The way it is calculated is that its based on the 20 SMA. For each currency vs the other crosses:
if the SMA is pointing up and price is higher = +2
if the SMA is pointing up and price is lower = +1
if the SMA is pointing down and price is higher = -2
if the SMA is pointing down and price is lower = -1
So if we where considering GBP. We would do that for GBPNZD, GBPAUD, GBPPJY, GBPCHF, GBPEUR, GBPCAD, GBPUSD. We would then consider this sum against all the currencies to understand the relative strength.
Due to the limit on how many instruments can be called in a single indicated you need to load it for each currencies so 8 currencies = 8 indicators.
Its a bit of a frankinstien script - it just throw it togeather so its probably got redundant code etc. Its built around 20 SMA - no idea what would happens when you change that.
릴리즈 노트
Now you can cover 4 currencies with 1 indicator. (2 instances will cover all 8 majors and crosses)릴리즈 노트
Now loads all currencies in 1 indicator릴리즈 노트
fixing problem오픈 소스 스크립트
트레이딩뷰의 진정한 정신에 따라, 이 스크립트의 작성자는 이를 오픈소스로 공개하여 트레이더들이 기능을 검토하고 검증할 수 있도록 했습니다. 작성자에게 찬사를 보냅니다! 이 코드는 무료로 사용할 수 있지만, 코드를 재게시하는 경우 하우스 룰이 적용된다는 점을 기억하세요.
면책사항
해당 정보와 게시물은 금융, 투자, 트레이딩 또는 기타 유형의 조언이나 권장 사항으로 간주되지 않으며, 트레이딩뷰에서 제공하거나 보증하는 것이 아닙니다. 자세한 내용은 이용 약관을 참조하세요.
오픈 소스 스크립트
트레이딩뷰의 진정한 정신에 따라, 이 스크립트의 작성자는 이를 오픈소스로 공개하여 트레이더들이 기능을 검토하고 검증할 수 있도록 했습니다. 작성자에게 찬사를 보냅니다! 이 코드는 무료로 사용할 수 있지만, 코드를 재게시하는 경우 하우스 룰이 적용된다는 점을 기억하세요.
면책사항
해당 정보와 게시물은 금융, 투자, 트레이딩 또는 기타 유형의 조언이나 권장 사항으로 간주되지 않으며, 트레이딩뷰에서 제공하거나 보증하는 것이 아닙니다. 자세한 내용은 이용 약관을 참조하세요.