OPEN-SOURCE SCRIPT
업데이트됨 High/Low mura vision
Description
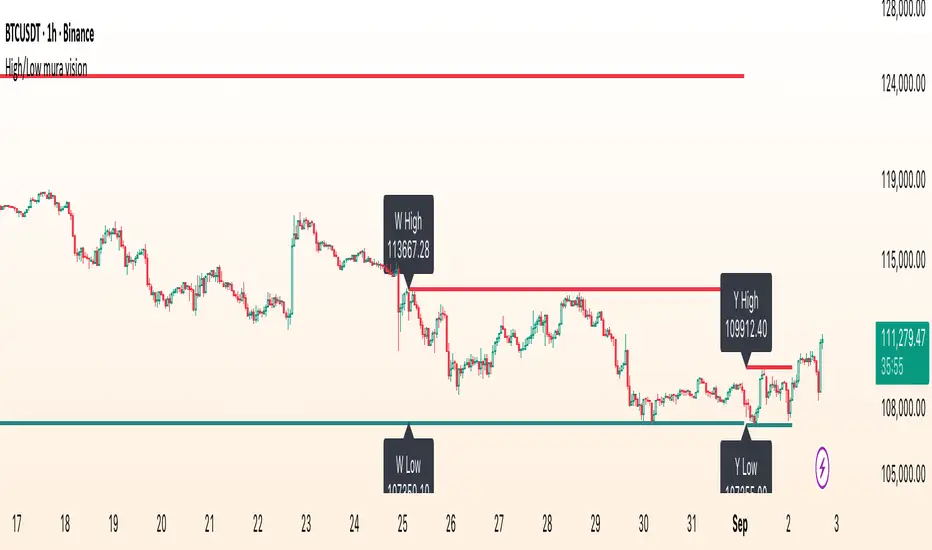
High/Low mura vision plots static support and resistance lines based on the completed high and low values of the prior trading day, week and calendar month.
This script:
How It Works
Key Features
How to Use
Inputs
Disclaimer
This script is provided “as‐is” under the Public License. It is intended for educational and analytical purposes only and does not constitute trading or investment advice. Past performance does not guarantee future results. Always perform your own analysis and manage risk responsibly.
High/Low mura vision plots static support and resistance lines based on the completed high and low values of the prior trading day, week and calendar month.
This script:
- Anchors each level to the exact start and end bars of the completed period
- Does not repaint or extend levels into the current period
- Uses request.security() to retrieve only historical data (no lookahead)
- This indicator was built to give traders clear, unambiguous reference points for breakout entries, pullback targets or confirmation of supply/demand zones without guessing where to draw manually.
How It Works
- At the close of each daily candle, the script captures high[1] and low[1] via request.security() and draws flat lines spanning only that day’s bars.
- Similarly, at the close of Friday’s weekly candle and the last bar of each calendar month, it draws the completed week’s and month’s high/low ranges.
- All lines are deleted and redrawn only once per period completion, ensuring no forward painting or hidden repainting logic.
Key Features
- No repaint: levels appear exactly once, immediately after the period closes
- Period‑specific: lines confined to the bars of the prior day, week or month
- Customizable: toggle each period on/off; choose independent colors, line styles (Solid, Dotted, Dashed) and width
- Lightweight: minimal calculations for maximum performance on any timeframe
How to Use
- Apply to any chart (M1 to MN).
- In the Inputs panel, enable the levels you need: Yesterday, Last Week or Last Month.
- Adjust High and Low line color, style and thickness to suit your chart layout.
- Use these historic levels for support/resistance, breakout confirmation or confluence with other tools.
Inputs
- Show Yesterday’s High: toggle yesterday’s high line
- Show Yesterday’s Low: toggle yesterday’s low line
- Show Last Week’s High: toggle last week’s high line
- Show Last Week’s Low: toggle last week’s low line
- Show Last Month’s High: toggle last month’s high line
- Show Last Month’s Low: toggle last month’s low line
- High Line Color / Low Line Color: choose colors for each set of lines
- High Line Style / Low Line Style: select Solid, Dotted or Dashed
- Line Width: adjust overall thickness
Disclaimer
This script is provided “as‐is” under the Public License. It is intended for educational and analytical purposes only and does not constitute trading or investment advice. Past performance does not guarantee future results. Always perform your own analysis and manage risk responsibly.
릴리즈 노트
Made some minor changes오픈 소스 스크립트
트레이딩뷰의 진정한 정신에 따라, 이 스크립트의 작성자는 이를 오픈소스로 공개하여 트레이더들이 기능을 검토하고 검증할 수 있도록 했습니다. 작성자에게 찬사를 보냅니다! 이 코드는 무료로 사용할 수 있지만, 코드를 재게시하는 경우 하우스 룰이 적용된다는 점을 기억하세요.
✅My Telegram
t.me/trading_mura
t.me/trading_mura
면책사항
해당 정보와 게시물은 금융, 투자, 트레이딩 또는 기타 유형의 조언이나 권장 사항으로 간주되지 않으며, 트레이딩뷰에서 제공하거나 보증하는 것이 아닙니다. 자세한 내용은 이용 약관을 참조하세요.
오픈 소스 스크립트
트레이딩뷰의 진정한 정신에 따라, 이 스크립트의 작성자는 이를 오픈소스로 공개하여 트레이더들이 기능을 검토하고 검증할 수 있도록 했습니다. 작성자에게 찬사를 보냅니다! 이 코드는 무료로 사용할 수 있지만, 코드를 재게시하는 경우 하우스 룰이 적용된다는 점을 기억하세요.
✅My Telegram
t.me/trading_mura
t.me/trading_mura
면책사항
해당 정보와 게시물은 금융, 투자, 트레이딩 또는 기타 유형의 조언이나 권장 사항으로 간주되지 않으며, 트레이딩뷰에서 제공하거나 보증하는 것이 아닙니다. 자세한 내용은 이용 약관을 참조하세요.