PROTECTED SOURCE SCRIPT
W%R & Stoch - MTF Table
✅ คำอธิบายภาษาไทย (Thai Description)
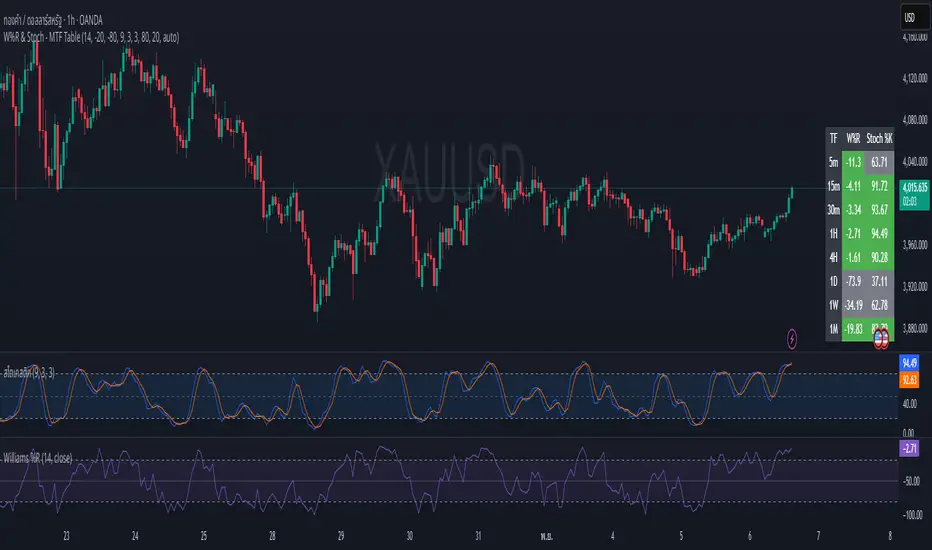
Williams %R & Stochastic (9,3,3) Multi-Timeframe Table
อินดิเคเตอร์นี้ออกแบบมาเพื่อช่วยเทรดเดอร์มองเห็นภาวะ Overbought / Oversold ของราคาใน หลายกรอบเวลา โดยแสดงผลเป็น ตารางมุมขวาล่าง เพื่อให้สามารถประเมินโมเมนตัมของตลาดได้อย่างรวดเร็วโดยไม่ต้องเปลี่ยน Timeframe ไปมา
🔍 Timeframes ที่แสดง
5m • 15m • 30m • 1H • 4H • 1D • 1W • 1M
📊 ค่าที่ใช้ประเมิน
Williams %R (W%R) → วัดตำแหน่งราคาปัจจุบันเทียบกับ High/Low ย้อนหลัง
Stochastic %K (9,3,3) → วัดโมเมนตัมและแรงเหวี่ยงของราคา
🎨 การลงสี (ตีความได้ทันที)
สถานะ เงื่อนไข สี
Overbought ค่า ≥ เกณฑ์ OB 🟩 เขียว
Oversold ค่า ≤ เกณฑ์ OS 🟥 แดง
ปกติ / กลางๆ อยู่ระหว่าง OB และ OS ⚪ เทา
🎯 วิธีนำไปใช้งาน
ถ้า หลาย TF เป็น Oversold (สีแดง) → มีโอกาสเกิด แรงดีดกลับขึ้น
ถ้า หลาย TF เป็น Overbought (สีเขียว) → มีโอกาสเกิด แรงกดลงของราคา
ถ้า TF ใหญ่ Oversold แต่ TF เล็กเริ่มกลับตัวขึ้น → เป็นจังหวะเข้าที่มีคุณภาพสูง
แนะนำให้ใช้ร่วมกับโครงสร้างราคา แนวรับ-แนวต้าน หรือ Volume เพื่อความแม่นยำที่มากขึ้น
=========================================================================
✅ English Description
Williams %R & Stochastic (9,3,3) Multi-Timeframe Table
This indicator provides a clear visual overview of momentum and market pressure across multiple timeframes by displaying a compact table in the bottom-right corner of the chart. It allows traders to quickly assess overbought/oversold conditions without switching timeframes.
🔍 Timeframes Displayed
5m • 15m • 30m • 1H • 4H • 1D • 1W • 1M
📊 Metrics Used
Williams %R (W%R) — measures price position relative to recent highs and lows
Stochastic %K (9,3,3) — measures momentum based on recent price swings
🎨 Color Coding (Quick Interpretation)
Status Condition Color
Overbought Value ≥ OB threshold 🟩 Green
Oversold Value ≤ OS threshold 🟥 Red
Neutral Between OB and OS ⚪ Gray
🎯 How to Use It
Multiple timeframes Oversold (Red) → Possible bullish reversal setup
Multiple timeframes Overbought (Green) → Possible bearish reversal setup
If higher timeframe is Oversold but lower timeframe begins to turn upward → high-quality entry timing
This indicator is not a standalone buy/sell signal.
Best used with market structure, support/resistance, and volume context.
Williams %R & Stochastic (9,3,3) Multi-Timeframe Table
อินดิเคเตอร์นี้ออกแบบมาเพื่อช่วยเทรดเดอร์มองเห็นภาวะ Overbought / Oversold ของราคาใน หลายกรอบเวลา โดยแสดงผลเป็น ตารางมุมขวาล่าง เพื่อให้สามารถประเมินโมเมนตัมของตลาดได้อย่างรวดเร็วโดยไม่ต้องเปลี่ยน Timeframe ไปมา
🔍 Timeframes ที่แสดง
5m • 15m • 30m • 1H • 4H • 1D • 1W • 1M
📊 ค่าที่ใช้ประเมิน
Williams %R (W%R) → วัดตำแหน่งราคาปัจจุบันเทียบกับ High/Low ย้อนหลัง
Stochastic %K (9,3,3) → วัดโมเมนตัมและแรงเหวี่ยงของราคา
🎨 การลงสี (ตีความได้ทันที)
สถานะ เงื่อนไข สี
Overbought ค่า ≥ เกณฑ์ OB 🟩 เขียว
Oversold ค่า ≤ เกณฑ์ OS 🟥 แดง
ปกติ / กลางๆ อยู่ระหว่าง OB และ OS ⚪ เทา
🎯 วิธีนำไปใช้งาน
ถ้า หลาย TF เป็น Oversold (สีแดง) → มีโอกาสเกิด แรงดีดกลับขึ้น
ถ้า หลาย TF เป็น Overbought (สีเขียว) → มีโอกาสเกิด แรงกดลงของราคา
ถ้า TF ใหญ่ Oversold แต่ TF เล็กเริ่มกลับตัวขึ้น → เป็นจังหวะเข้าที่มีคุณภาพสูง
แนะนำให้ใช้ร่วมกับโครงสร้างราคา แนวรับ-แนวต้าน หรือ Volume เพื่อความแม่นยำที่มากขึ้น
=========================================================================
✅ English Description
Williams %R & Stochastic (9,3,3) Multi-Timeframe Table
This indicator provides a clear visual overview of momentum and market pressure across multiple timeframes by displaying a compact table in the bottom-right corner of the chart. It allows traders to quickly assess overbought/oversold conditions without switching timeframes.
🔍 Timeframes Displayed
5m • 15m • 30m • 1H • 4H • 1D • 1W • 1M
📊 Metrics Used
Williams %R (W%R) — measures price position relative to recent highs and lows
Stochastic %K (9,3,3) — measures momentum based on recent price swings
🎨 Color Coding (Quick Interpretation)
Status Condition Color
Overbought Value ≥ OB threshold 🟩 Green
Oversold Value ≤ OS threshold 🟥 Red
Neutral Between OB and OS ⚪ Gray
🎯 How to Use It
Multiple timeframes Oversold (Red) → Possible bullish reversal setup
Multiple timeframes Overbought (Green) → Possible bearish reversal setup
If higher timeframe is Oversold but lower timeframe begins to turn upward → high-quality entry timing
This indicator is not a standalone buy/sell signal.
Best used with market structure, support/resistance, and volume context.
보호된 스크립트입니다
이 스크립트는 비공개 소스로 게시됩니다. 하지만 제한 없이 자유롭게 사용할 수 있습니다 — 여기에서 자세히 알아보기.
면책사항
이 정보와 게시물은 TradingView에서 제공하거나 보증하는 금융, 투자, 거래 또는 기타 유형의 조언이나 권고 사항을 의미하거나 구성하지 않습니다. 자세한 내용은 이용 약관을 참고하세요.
보호된 스크립트입니다
이 스크립트는 비공개 소스로 게시됩니다. 하지만 제한 없이 자유롭게 사용할 수 있습니다 — 여기에서 자세히 알아보기.
면책사항
이 정보와 게시물은 TradingView에서 제공하거나 보증하는 금융, 투자, 거래 또는 기타 유형의 조언이나 권고 사항을 의미하거나 구성하지 않습니다. 자세한 내용은 이용 약관을 참고하세요.