INVITE-ONLY SCRIPT
RSI and RSI SMA Signal with Variable Levels
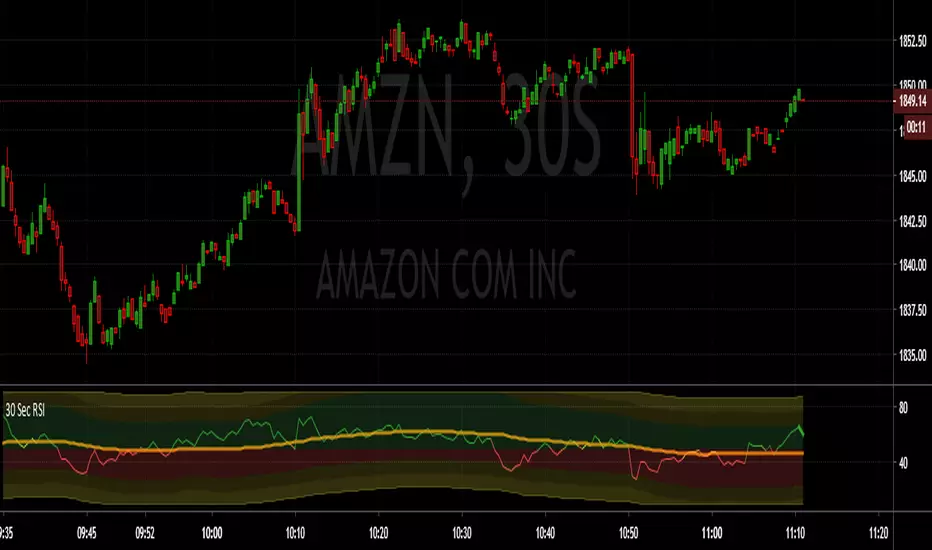
This script does the following:
Plots RSI to the existing resolution.
Plots the 50 SMA (sourced from the RSI)
Colors the line red when below the 50 SMA and RSI is below 50.
Colors the line green when above the 50 SMA and RSI is above 50.
Banding:
Green from 50 to 70
Dark yellow from 70-80 and 30-20
Red from 50 to 30
Brighter yellow from 80-90 and 20-10
The banding varies if there is a trend in the 50 SMA that holds below the 50 level. This way it defines the levels safe to maintain a position during and not during a trend.
You will notice that the red area increases and the OS yellow area(s) decreases if a short trend has developed.
You will notice that the green area increases and the OB yellow area(s) decreases if a long trend has developed.
The maximum levels are limited to 90 and 10.
초대 전용 스크립트
이 스크립트는 작성자가 승인한 사용자만 접근할 수 있습니다. 사용하려면 요청 후 승인을 받아야 하며, 일반적으로 결제 후에 허가가 부여됩니다. 자세한 내용은 아래 작성자의 안내를 따르거나 kmack282에게 직접 문의하세요.
트레이딩뷰는 스크립트의 작동 방식을 충분히 이해하고 작성자를 완전히 신뢰하지 않는 이상, 해당 스크립트에 비용을 지불하거나 사용하는 것을 권장하지 않습니다. 커뮤니티 스크립트에서 무료 오픈소스 대안을 찾아보실 수도 있습니다.
작성자 지시 사항
면책사항
해당 정보와 게시물은 금융, 투자, 트레이딩 또는 기타 유형의 조언이나 권장 사항으로 간주되지 않으며, 트레이딩뷰에서 제공하거나 보증하는 것이 아닙니다. 자세한 내용은 이용 약관을 참조하세요.