OPEN-SOURCE SCRIPT
CCT Bollinger Band Oscillator
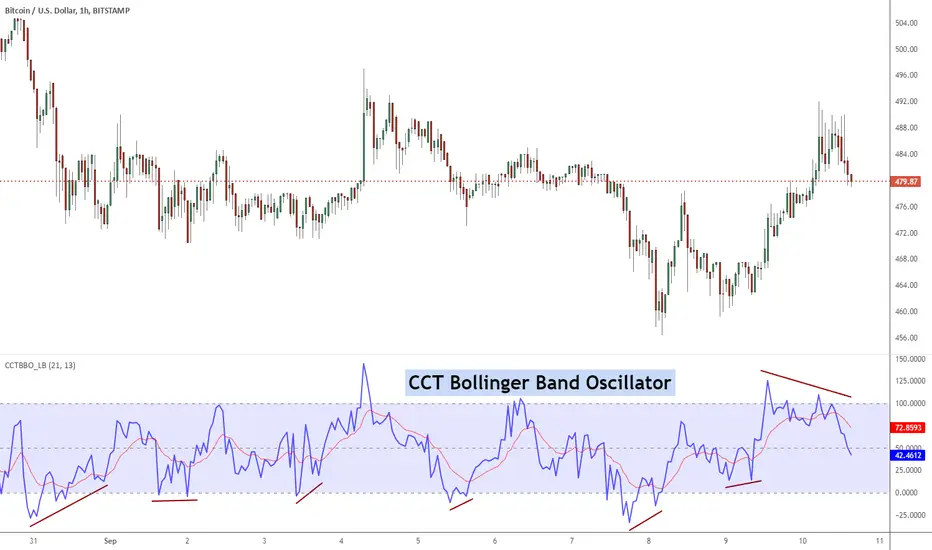
The CCT Bollinger Band Oscillator (CCTBO), developed by Steve Karnish of Cedar Creek Trading, reconfigures John Bollinger's classic Bollinger Bands (envelopes plotted at two Standard Deviations above and below a moving average) by drawing two parallel lines replacing the envelopes. The parallel lines represent a measurement of two Standard Deviations from the mean and are assigned a value of zero and 100 on the chart.
The indicator represents the price as it travels above and below the mean (50%) and outside the two standard deviations (zero and 100). Penetration of the upper band represents overbought conditions while penetration of the lower band signifies oversold conditions. Usage of the CCT Bollinger Band Oscillator to identify 'failure swings' and 'divergences' can lead to significant reversals.
List of my other indicators:
- Chart: tradingview.com/v/4IneGo8h/
- GDoc: docs.google.com/document/d/15AGCufJZ8CIUvwFJ9W-IKns88gkWOKBCvByMEvm5MLo/edit?usp=sharing
오픈 소스 스크립트
트레이딩뷰의 진정한 정신에 따라, 이 스크립트의 작성자는 이를 오픈소스로 공개하여 트레이더들이 기능을 검토하고 검증할 수 있도록 했습니다. 작성자에게 찬사를 보냅니다! 이 코드는 무료로 사용할 수 있지만, 코드를 재게시하는 경우 하우스 룰이 적용된다는 점을 기억하세요.
List of my free indicators: bit.ly/1LQaPK8
List of my indicators at Appstore: blog.tradingview.com/?p=970
List of my indicators at Appstore: blog.tradingview.com/?p=970
면책사항
해당 정보와 게시물은 금융, 투자, 트레이딩 또는 기타 유형의 조언이나 권장 사항으로 간주되지 않으며, 트레이딩뷰에서 제공하거나 보증하는 것이 아닙니다. 자세한 내용은 이용 약관을 참조하세요.