OPEN-SOURCE SCRIPT
업데이트됨 Relative Performance Spread
**Relative Performance Spread Indicator – Overview**
This indicator compares the **relative performance between two stocks** by normalizing their prices and calculating the **spread**, **area under the curve (AUC)**, or **normalized price ratio**.
### **How It Works**
* **Input**: Select a second stock (`ticker2`) and a moving average window.
* **Normalization**: Each stock is normalized by its own moving average → `norm = close / MA`.
* **Spread**: The difference `spread = norm1 - norm2` reflects which stock is outperforming.
* **AUC**: Cumulative spread over time shows prolonged dominance or underperformance.
* **Bounds**: Bollinger-style bands are drawn around the spread to assess deviation extremes.
### **Usage**
* **Plot Type Options**:
* `"Spread"`: Spot outperformance; crossing bands may signal rotation.
* `"AUC"`: Track long-term relative trend dominance.
* `"Normalized"`: Directly compare scaled price movements.
Use this tool for **pair trading**, **relative momentum**, or **rotation strategies**. It adapts well across assets with different price scales.
릴리즈 노트
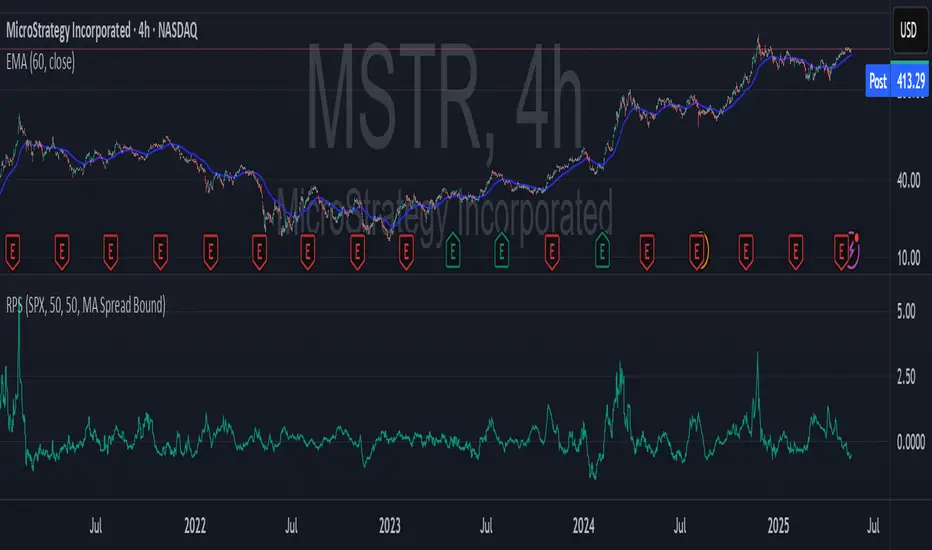
This indicator compares the performance of two stocks by analyzing their deviation from their own moving averages. It offers five plot modes:Spread: Shows the difference between the normalized prices of Stock 1 and Stock 2.
AUC (Area Under Curve): Cumulative spread over time, useful for detecting persistent out/underperformance.
Normalized: Plots each stock’s price relative to its moving average.
Z-Score Spread: Compares standardized deviations to highlight extreme divergences.
MA Spread Bound: Dynamically scales each stock’s deviation within upper/lower EMA bounds for robust comparison.
오픈 소스 스크립트
트레이딩뷰의 진정한 정신에 따라, 이 스크립트의 작성자는 이를 오픈소스로 공개하여 트레이더들이 기능을 검토하고 검증할 수 있도록 했습니다. 작성자에게 찬사를 보냅니다! 이 코드는 무료로 사용할 수 있지만, 코드를 재게시하는 경우 하우스 룰이 적용된다는 점을 기억하세요.
면책사항
해당 정보와 게시물은 금융, 투자, 트레이딩 또는 기타 유형의 조언이나 권장 사항으로 간주되지 않으며, 트레이딩뷰에서 제공하거나 보증하는 것이 아닙니다. 자세한 내용은 이용 약관을 참조하세요.
오픈 소스 스크립트
트레이딩뷰의 진정한 정신에 따라, 이 스크립트의 작성자는 이를 오픈소스로 공개하여 트레이더들이 기능을 검토하고 검증할 수 있도록 했습니다. 작성자에게 찬사를 보냅니다! 이 코드는 무료로 사용할 수 있지만, 코드를 재게시하는 경우 하우스 룰이 적용된다는 점을 기억하세요.
면책사항
해당 정보와 게시물은 금융, 투자, 트레이딩 또는 기타 유형의 조언이나 권장 사항으로 간주되지 않으며, 트레이딩뷰에서 제공하거나 보증하는 것이 아닙니다. 자세한 내용은 이용 약관을 참조하세요.